Diagrams
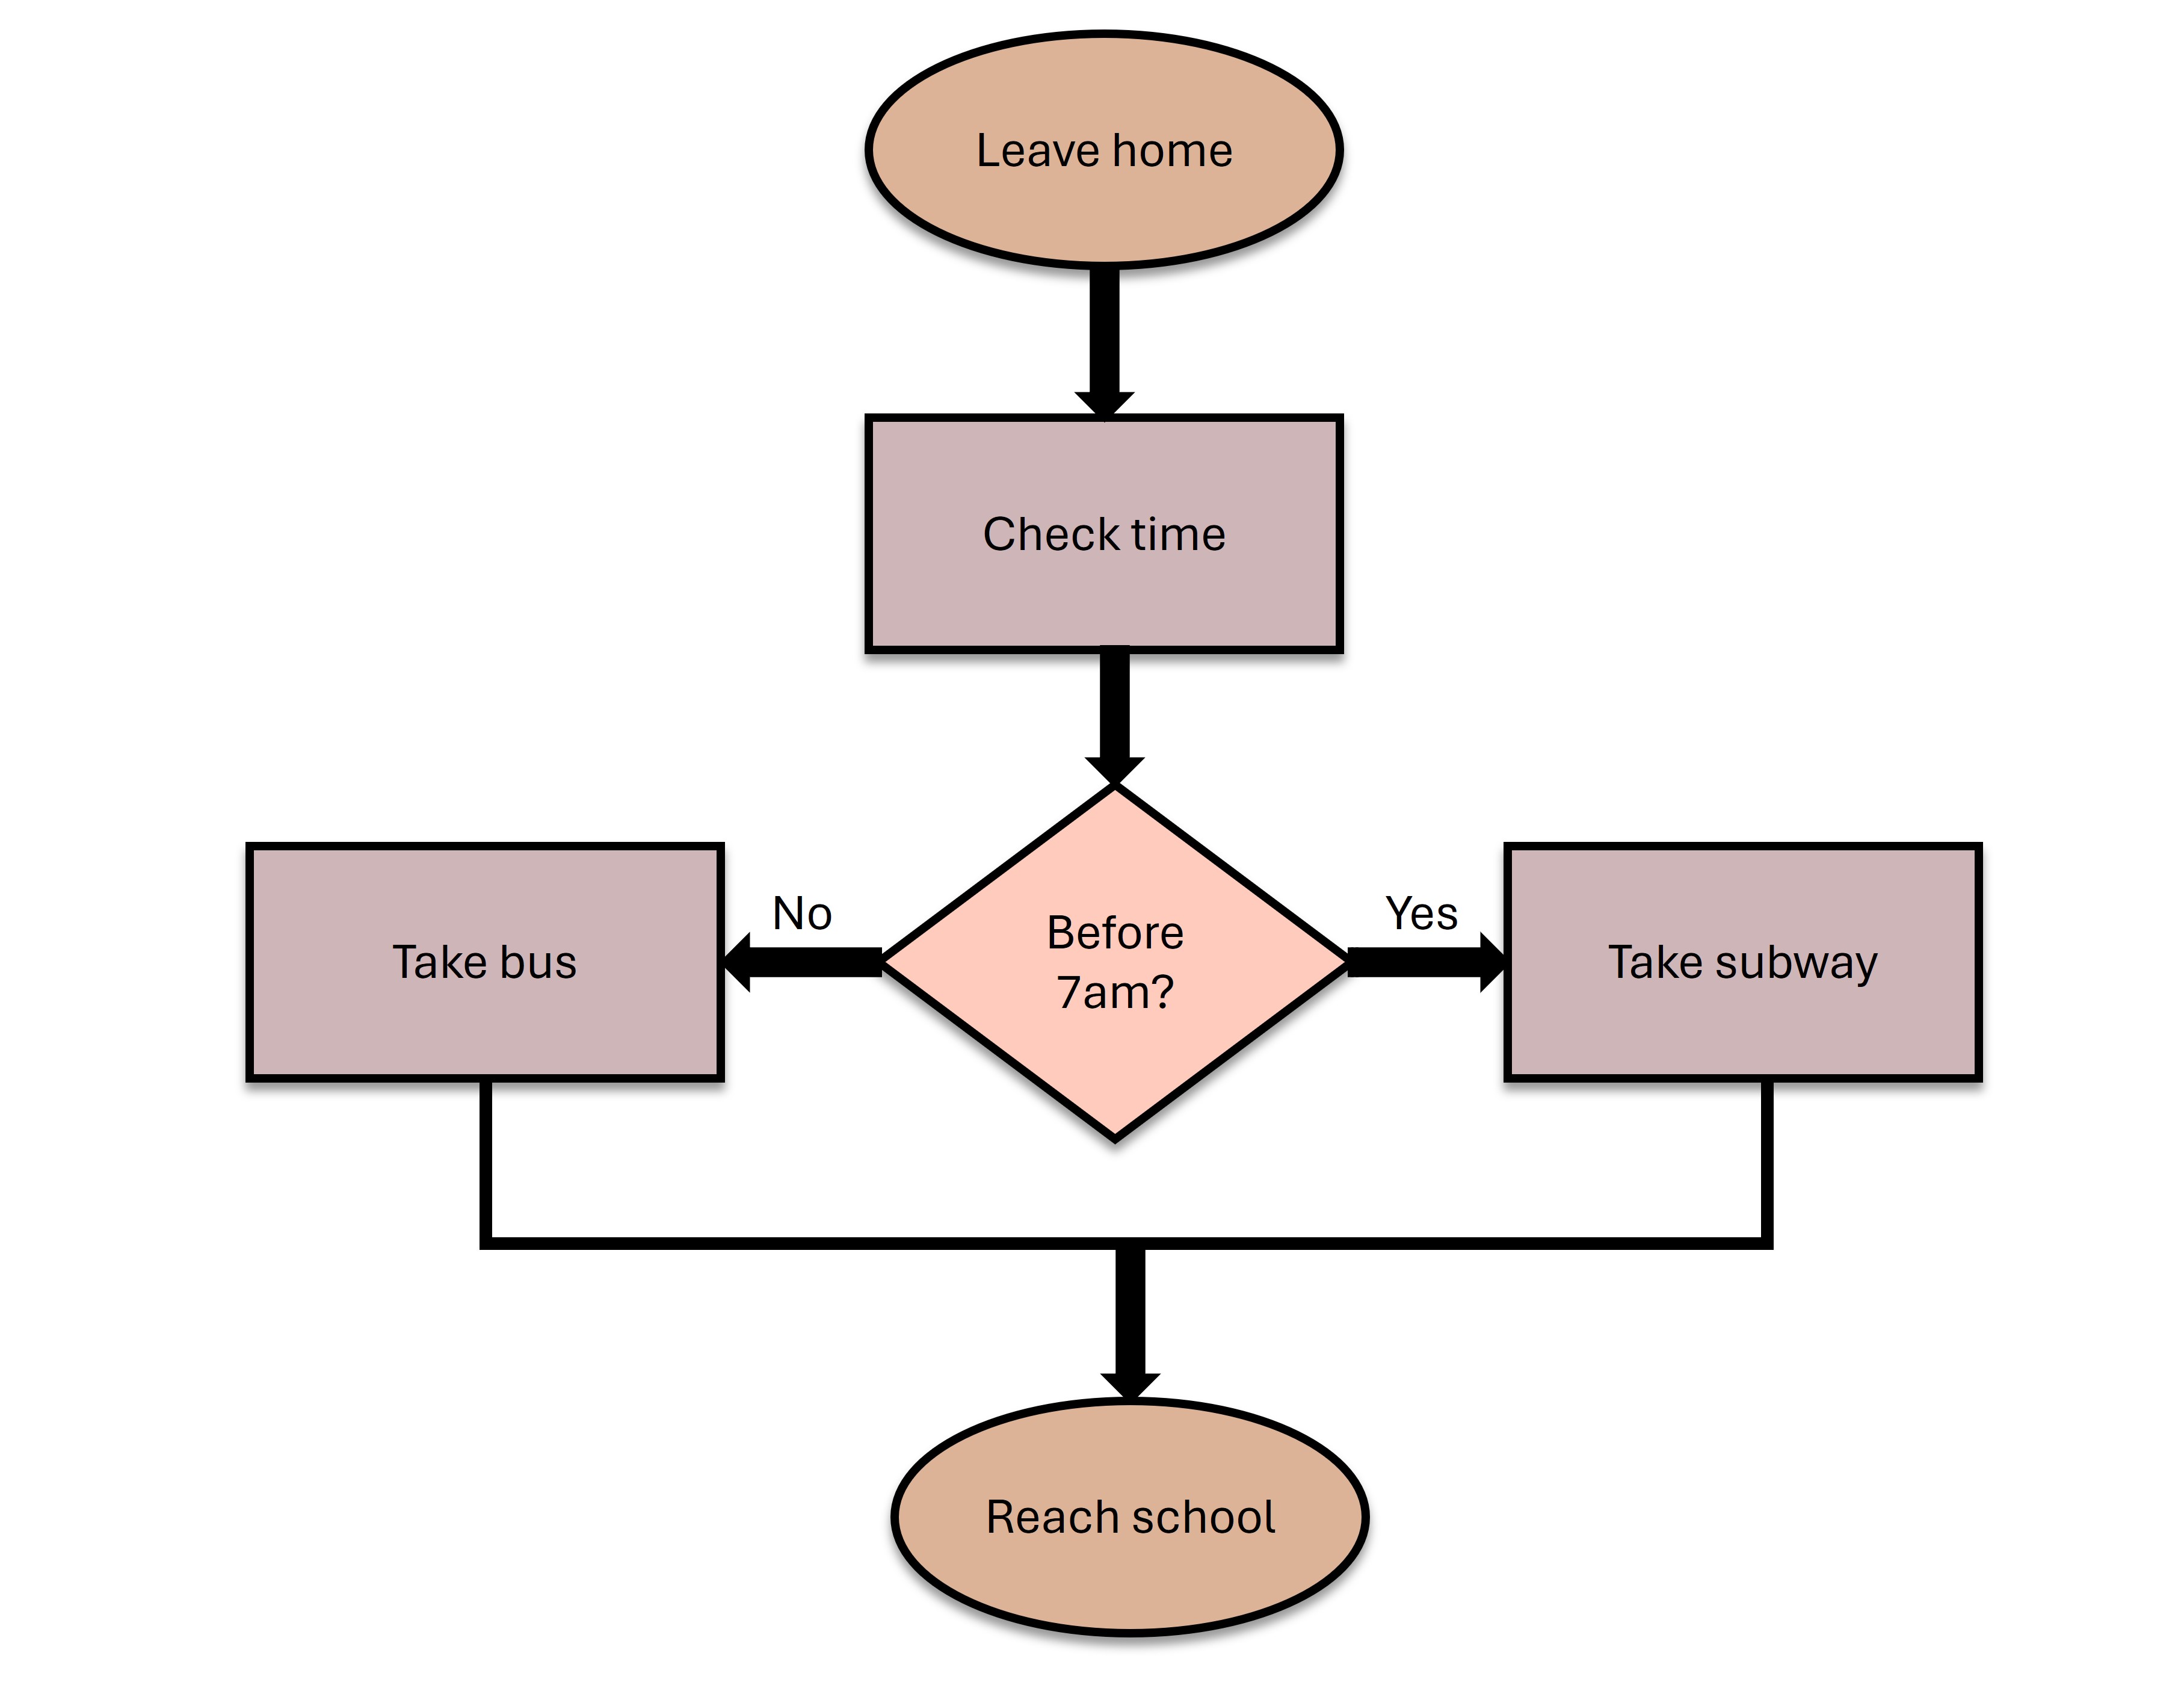
➧ Shows a process or workflow step by step.
➧ Uses arrows, boxes, and decision symbols.
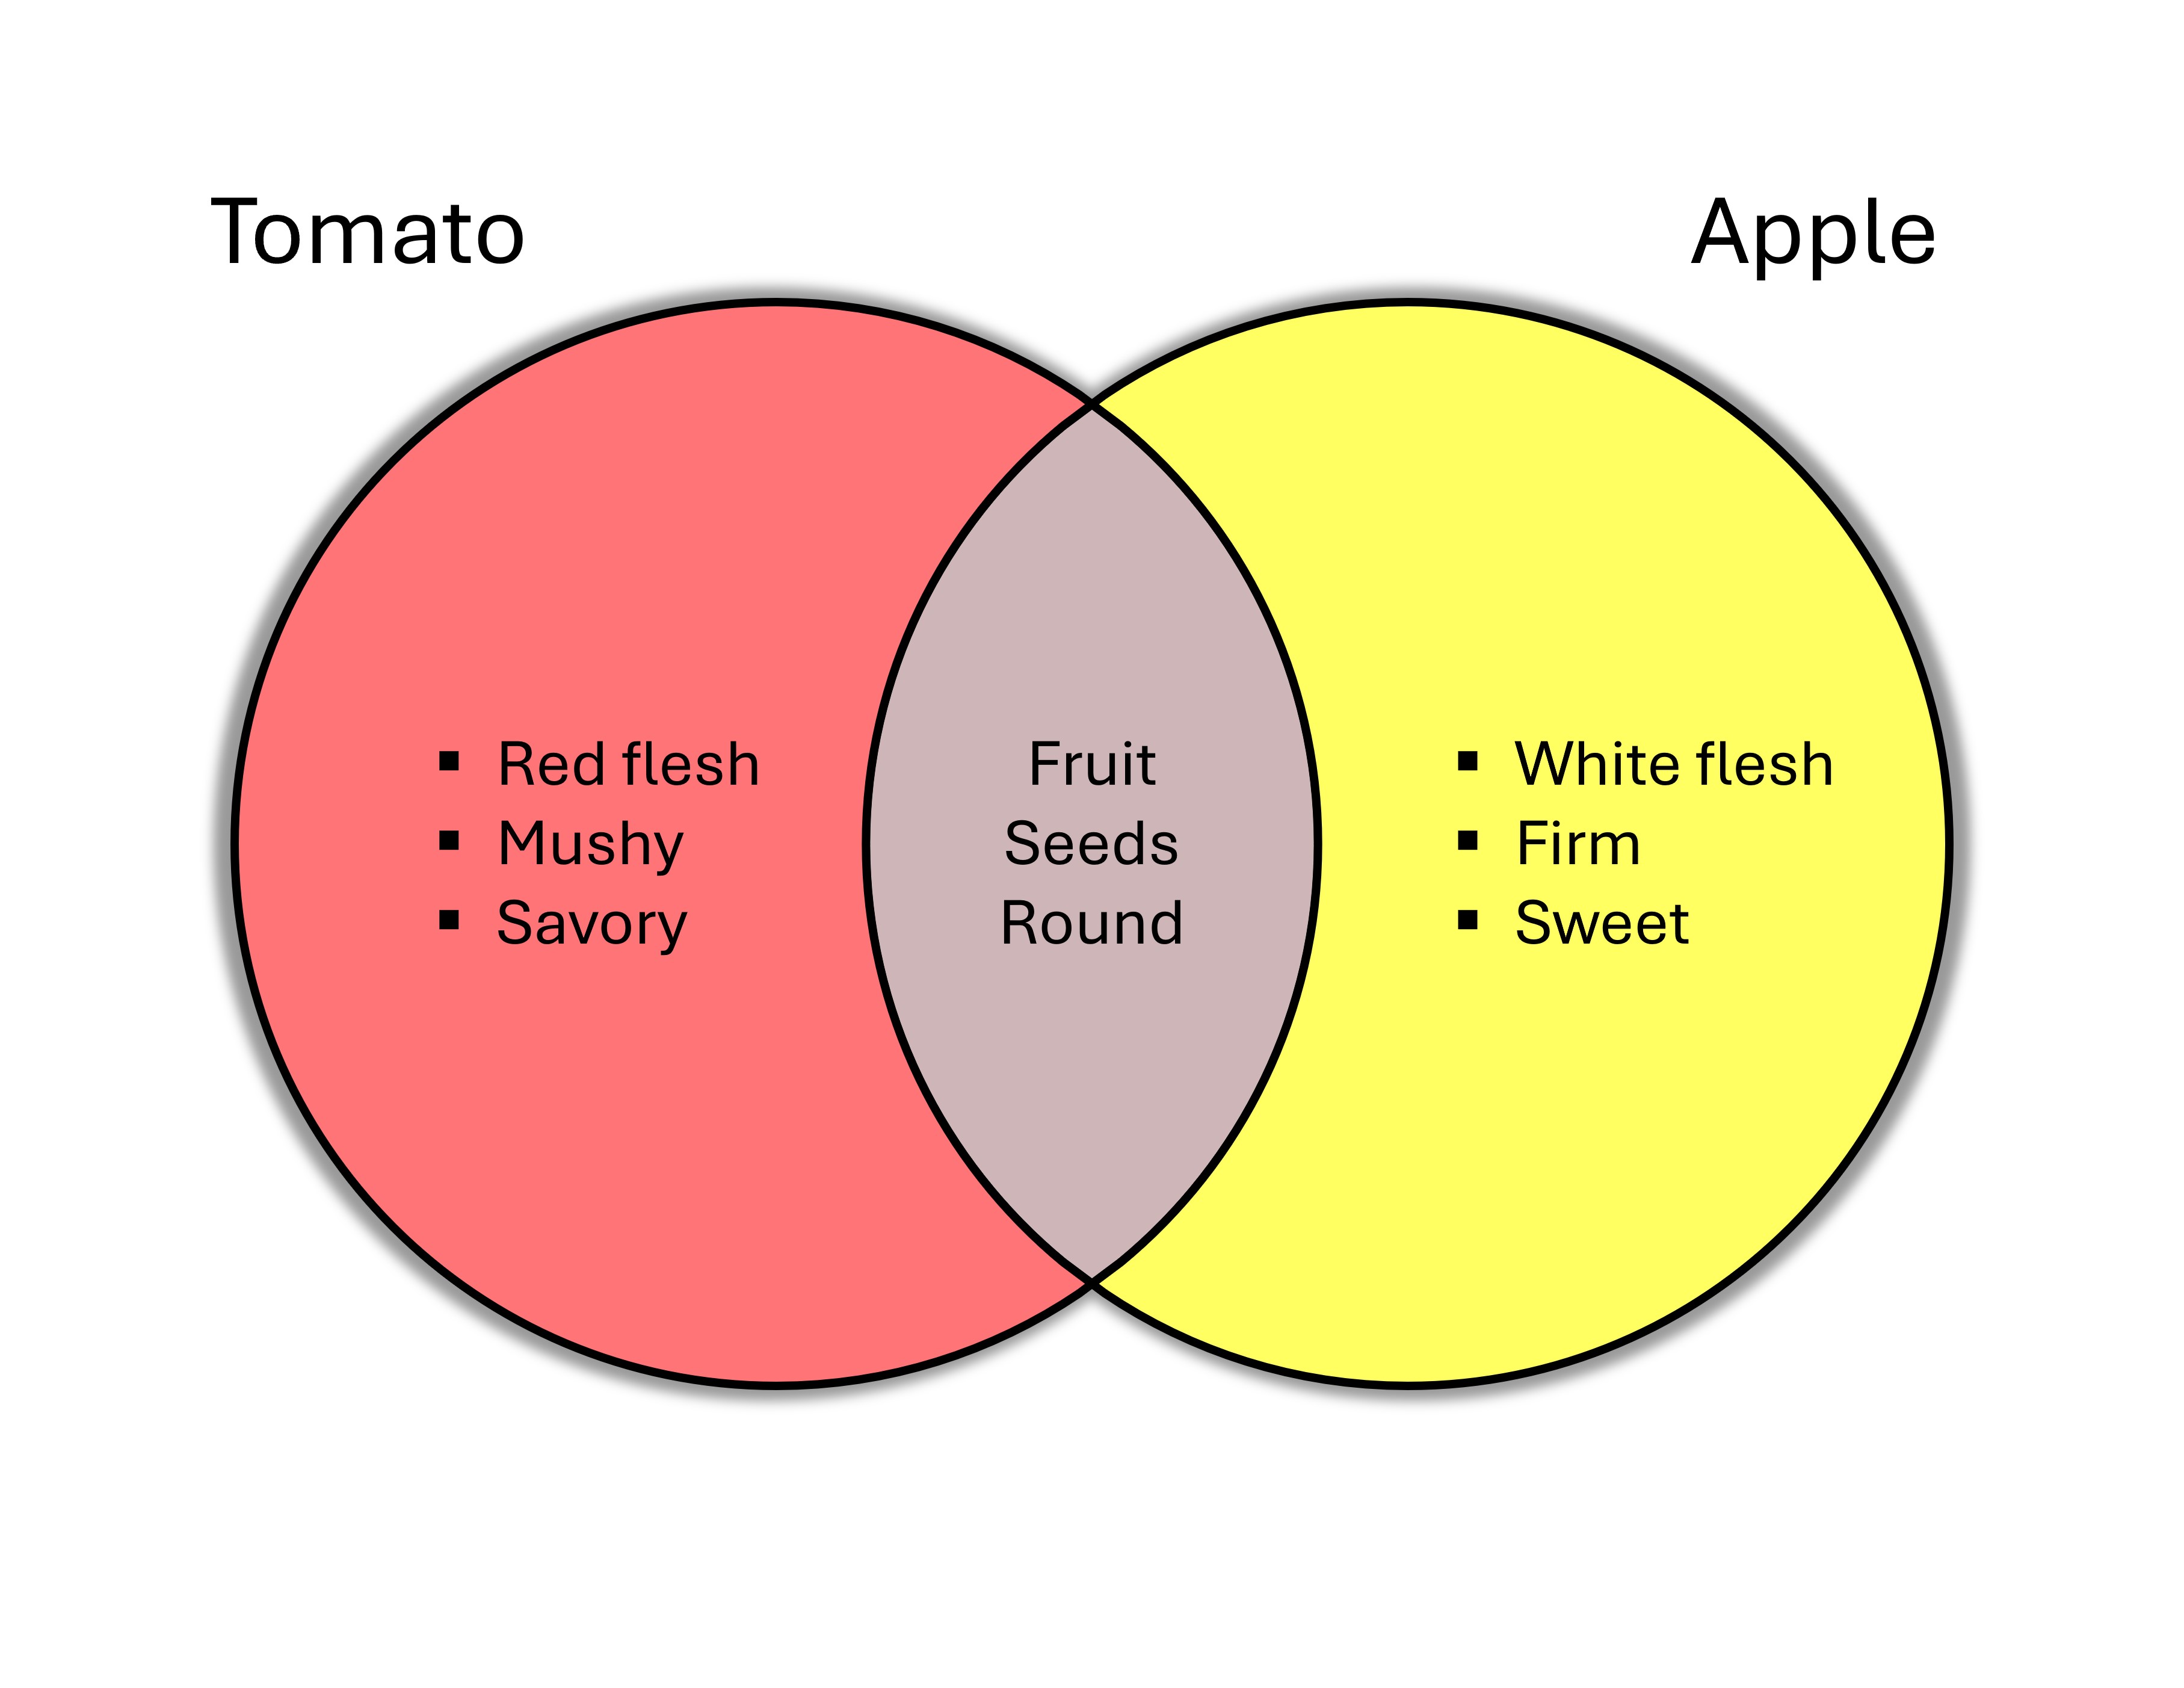
➧ Shows similarities and differences between groups.
➧ Uses overlapping circles.
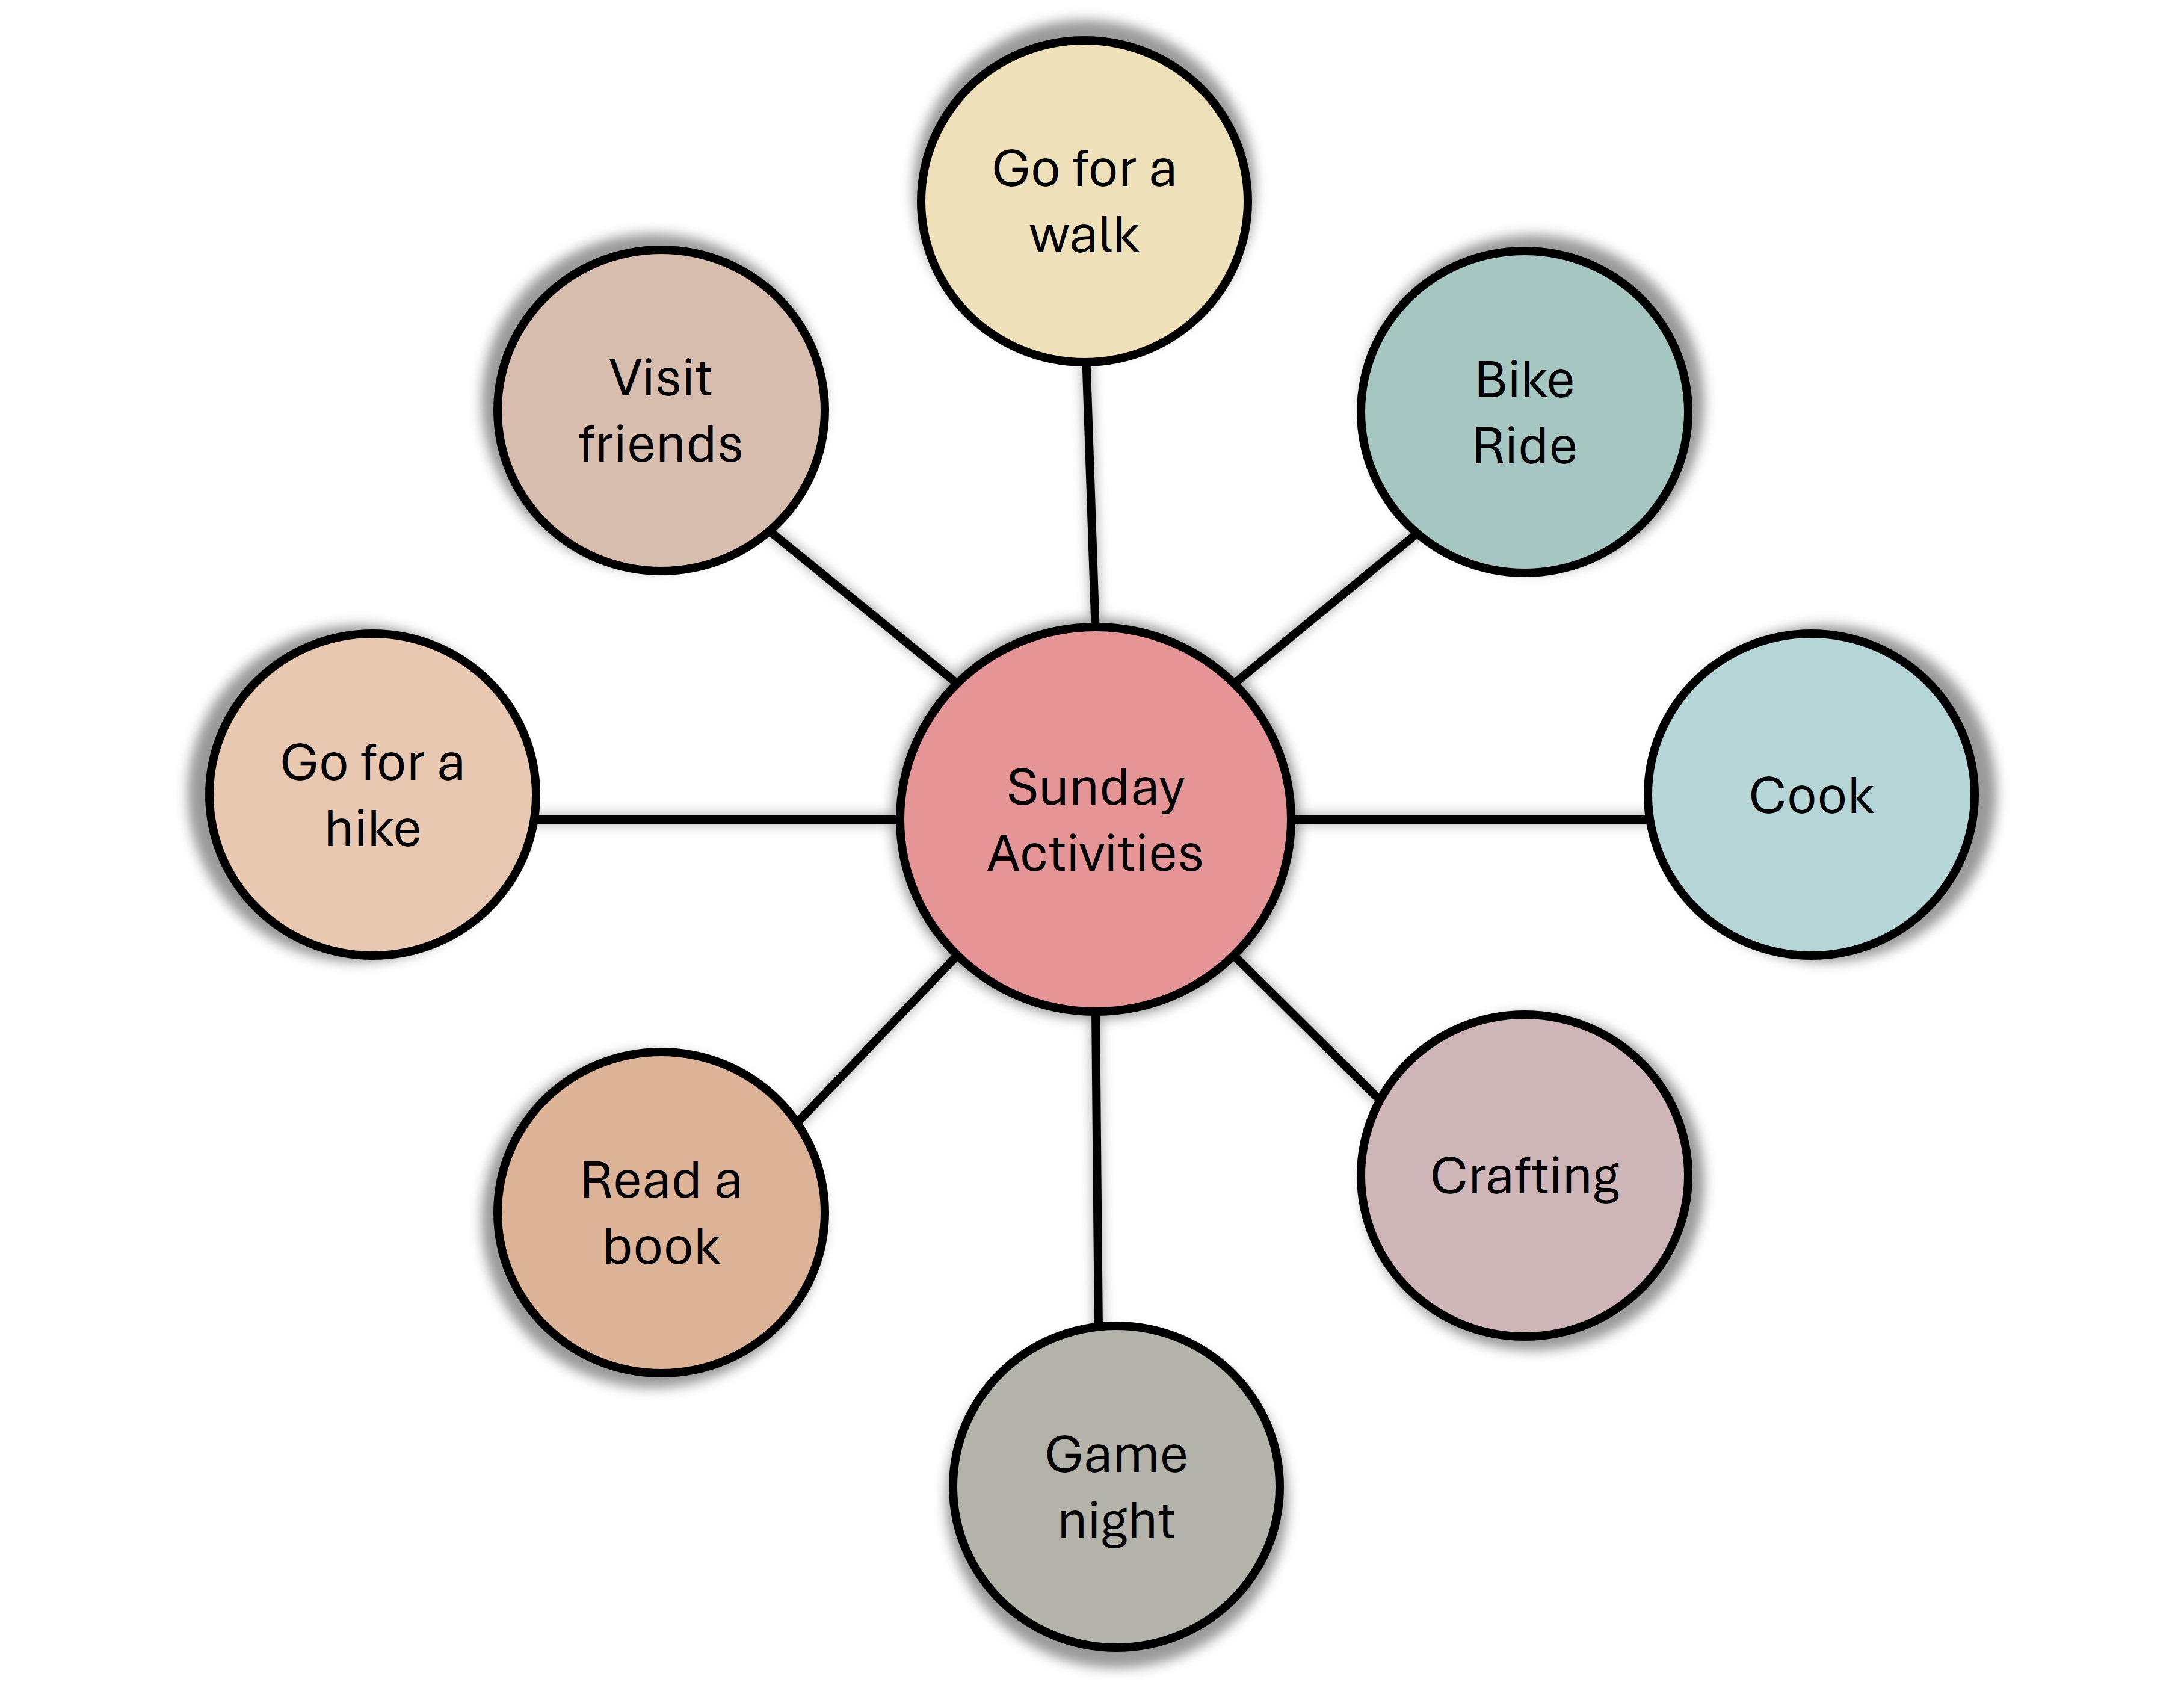
➧ A central idea with branching subtopics.
➧ Used for brainstorming and organizing ideas.
➧ Similar to mind maps but with more structure.
➧ Shows relationships between concepts with linking phrases..
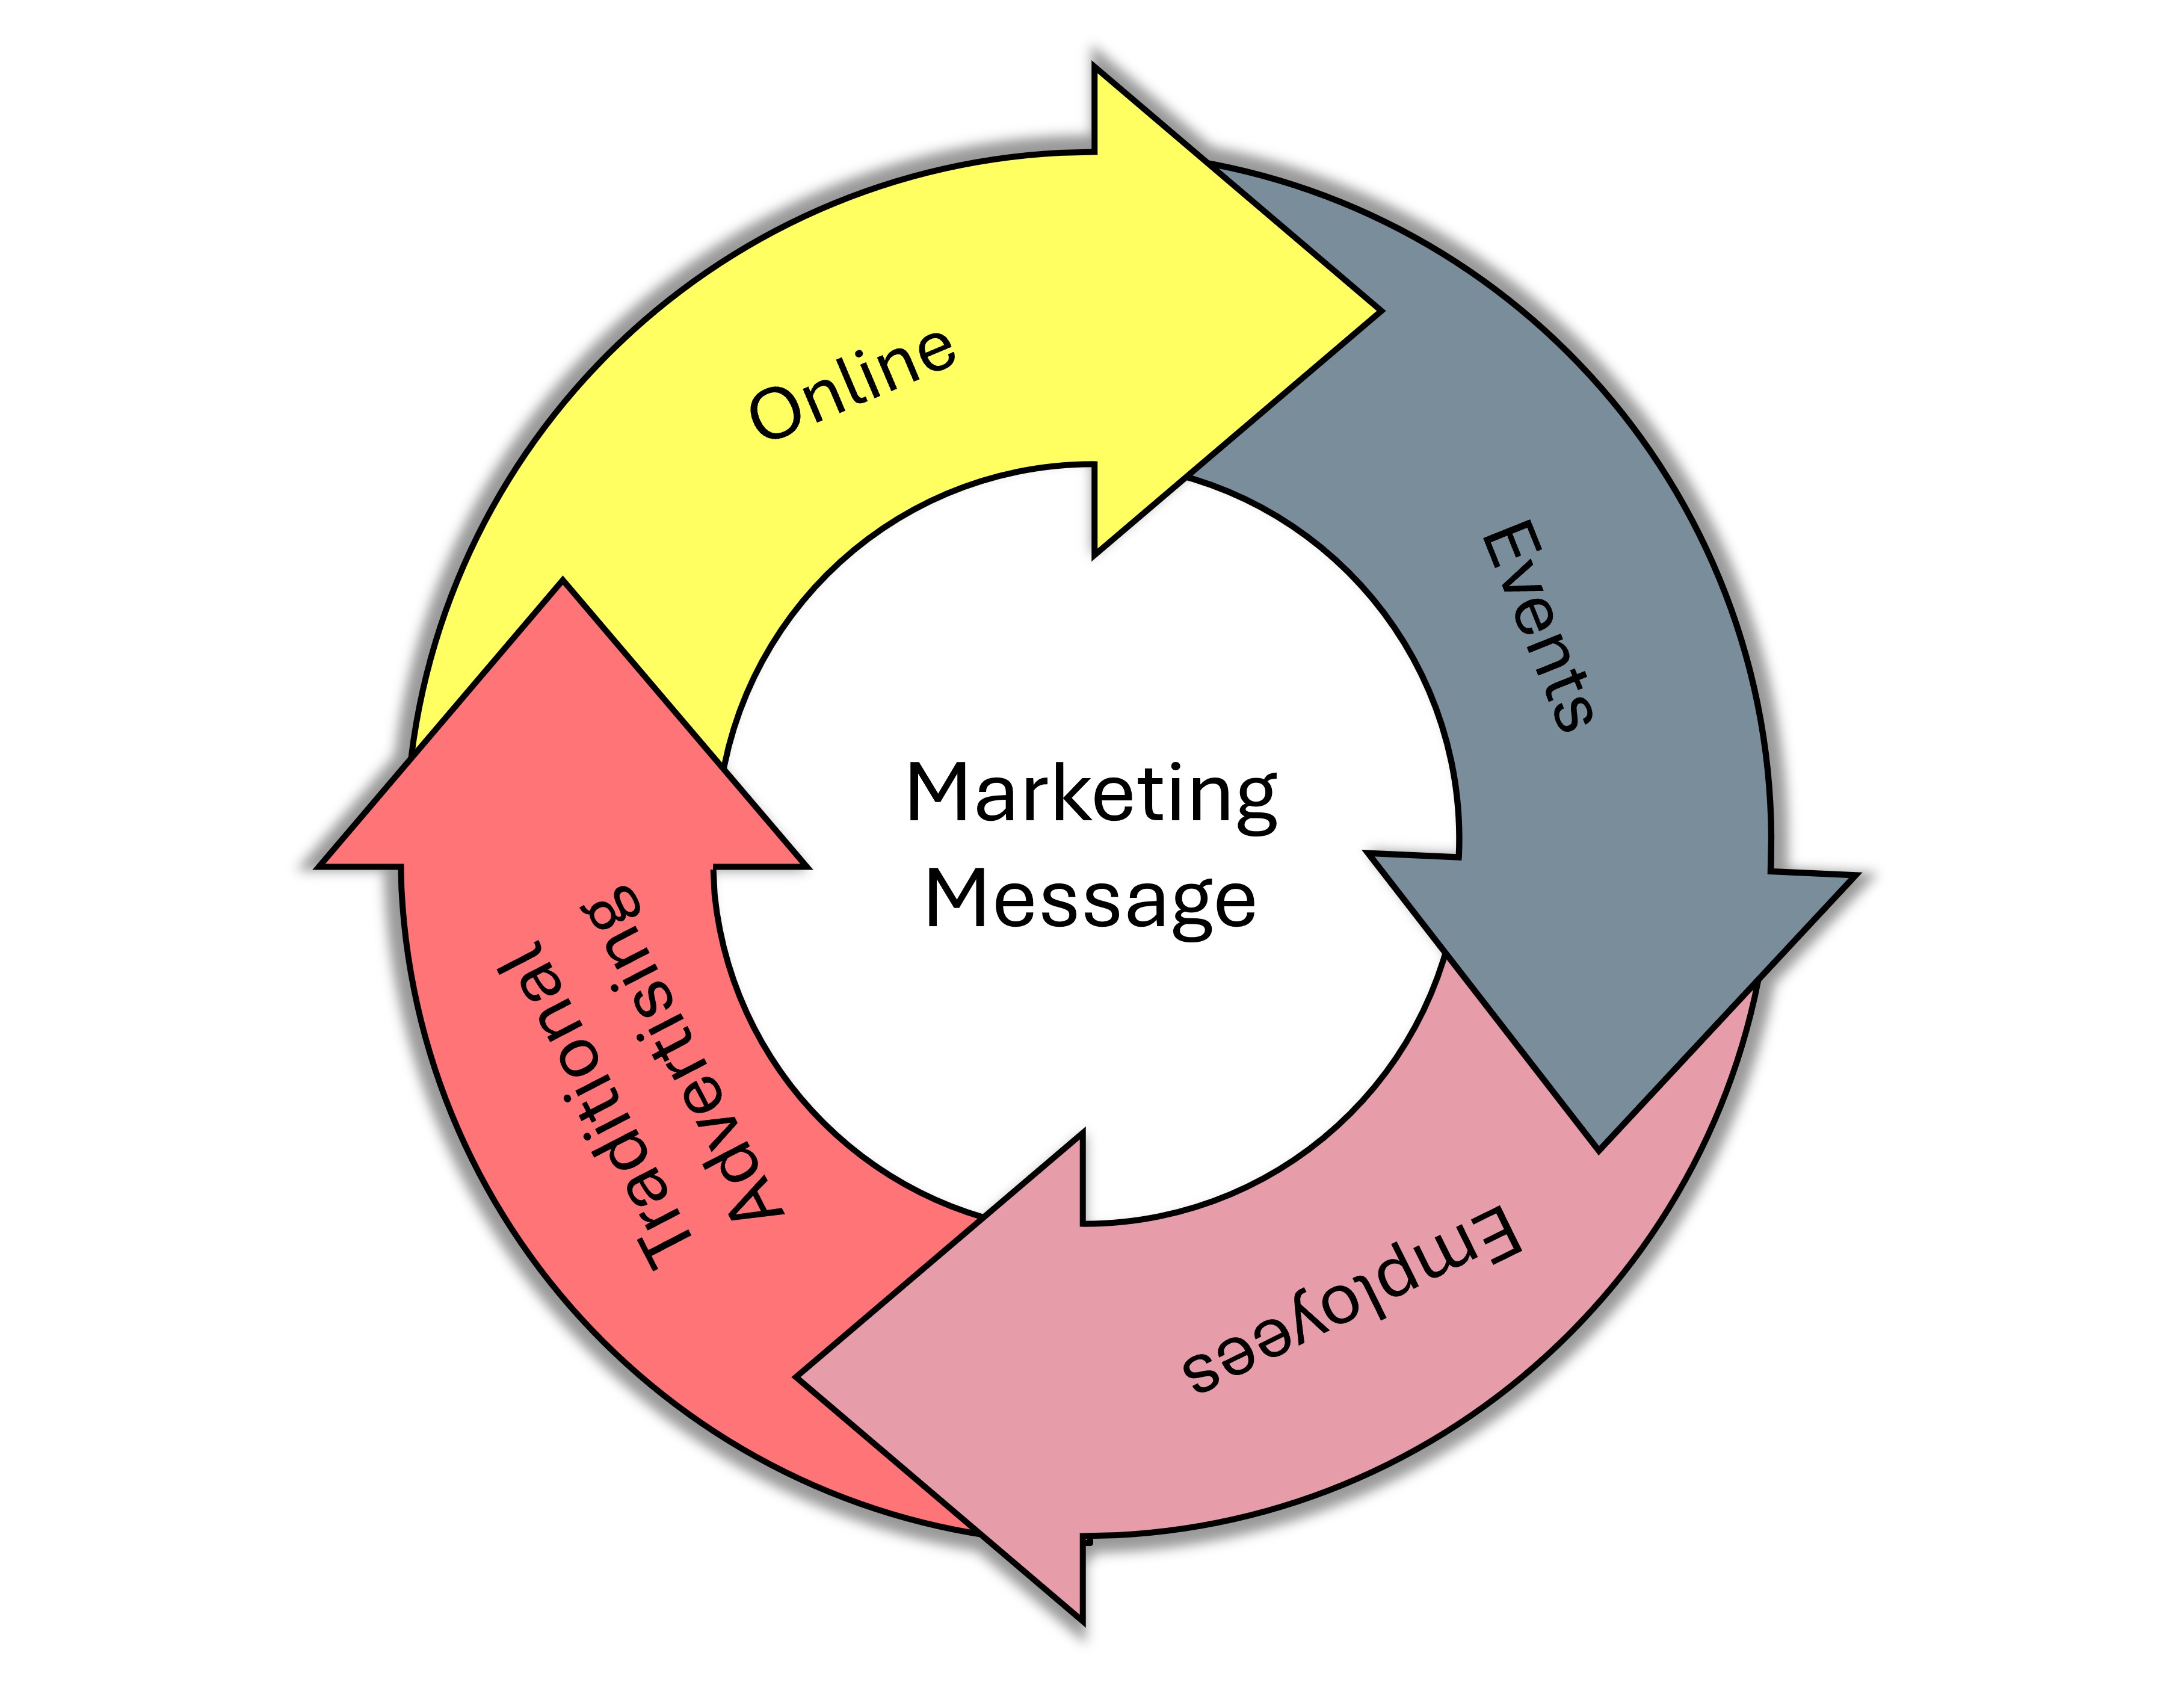
➧ Represents circular or repeating processes | e.g., life cycle, feedback loops.
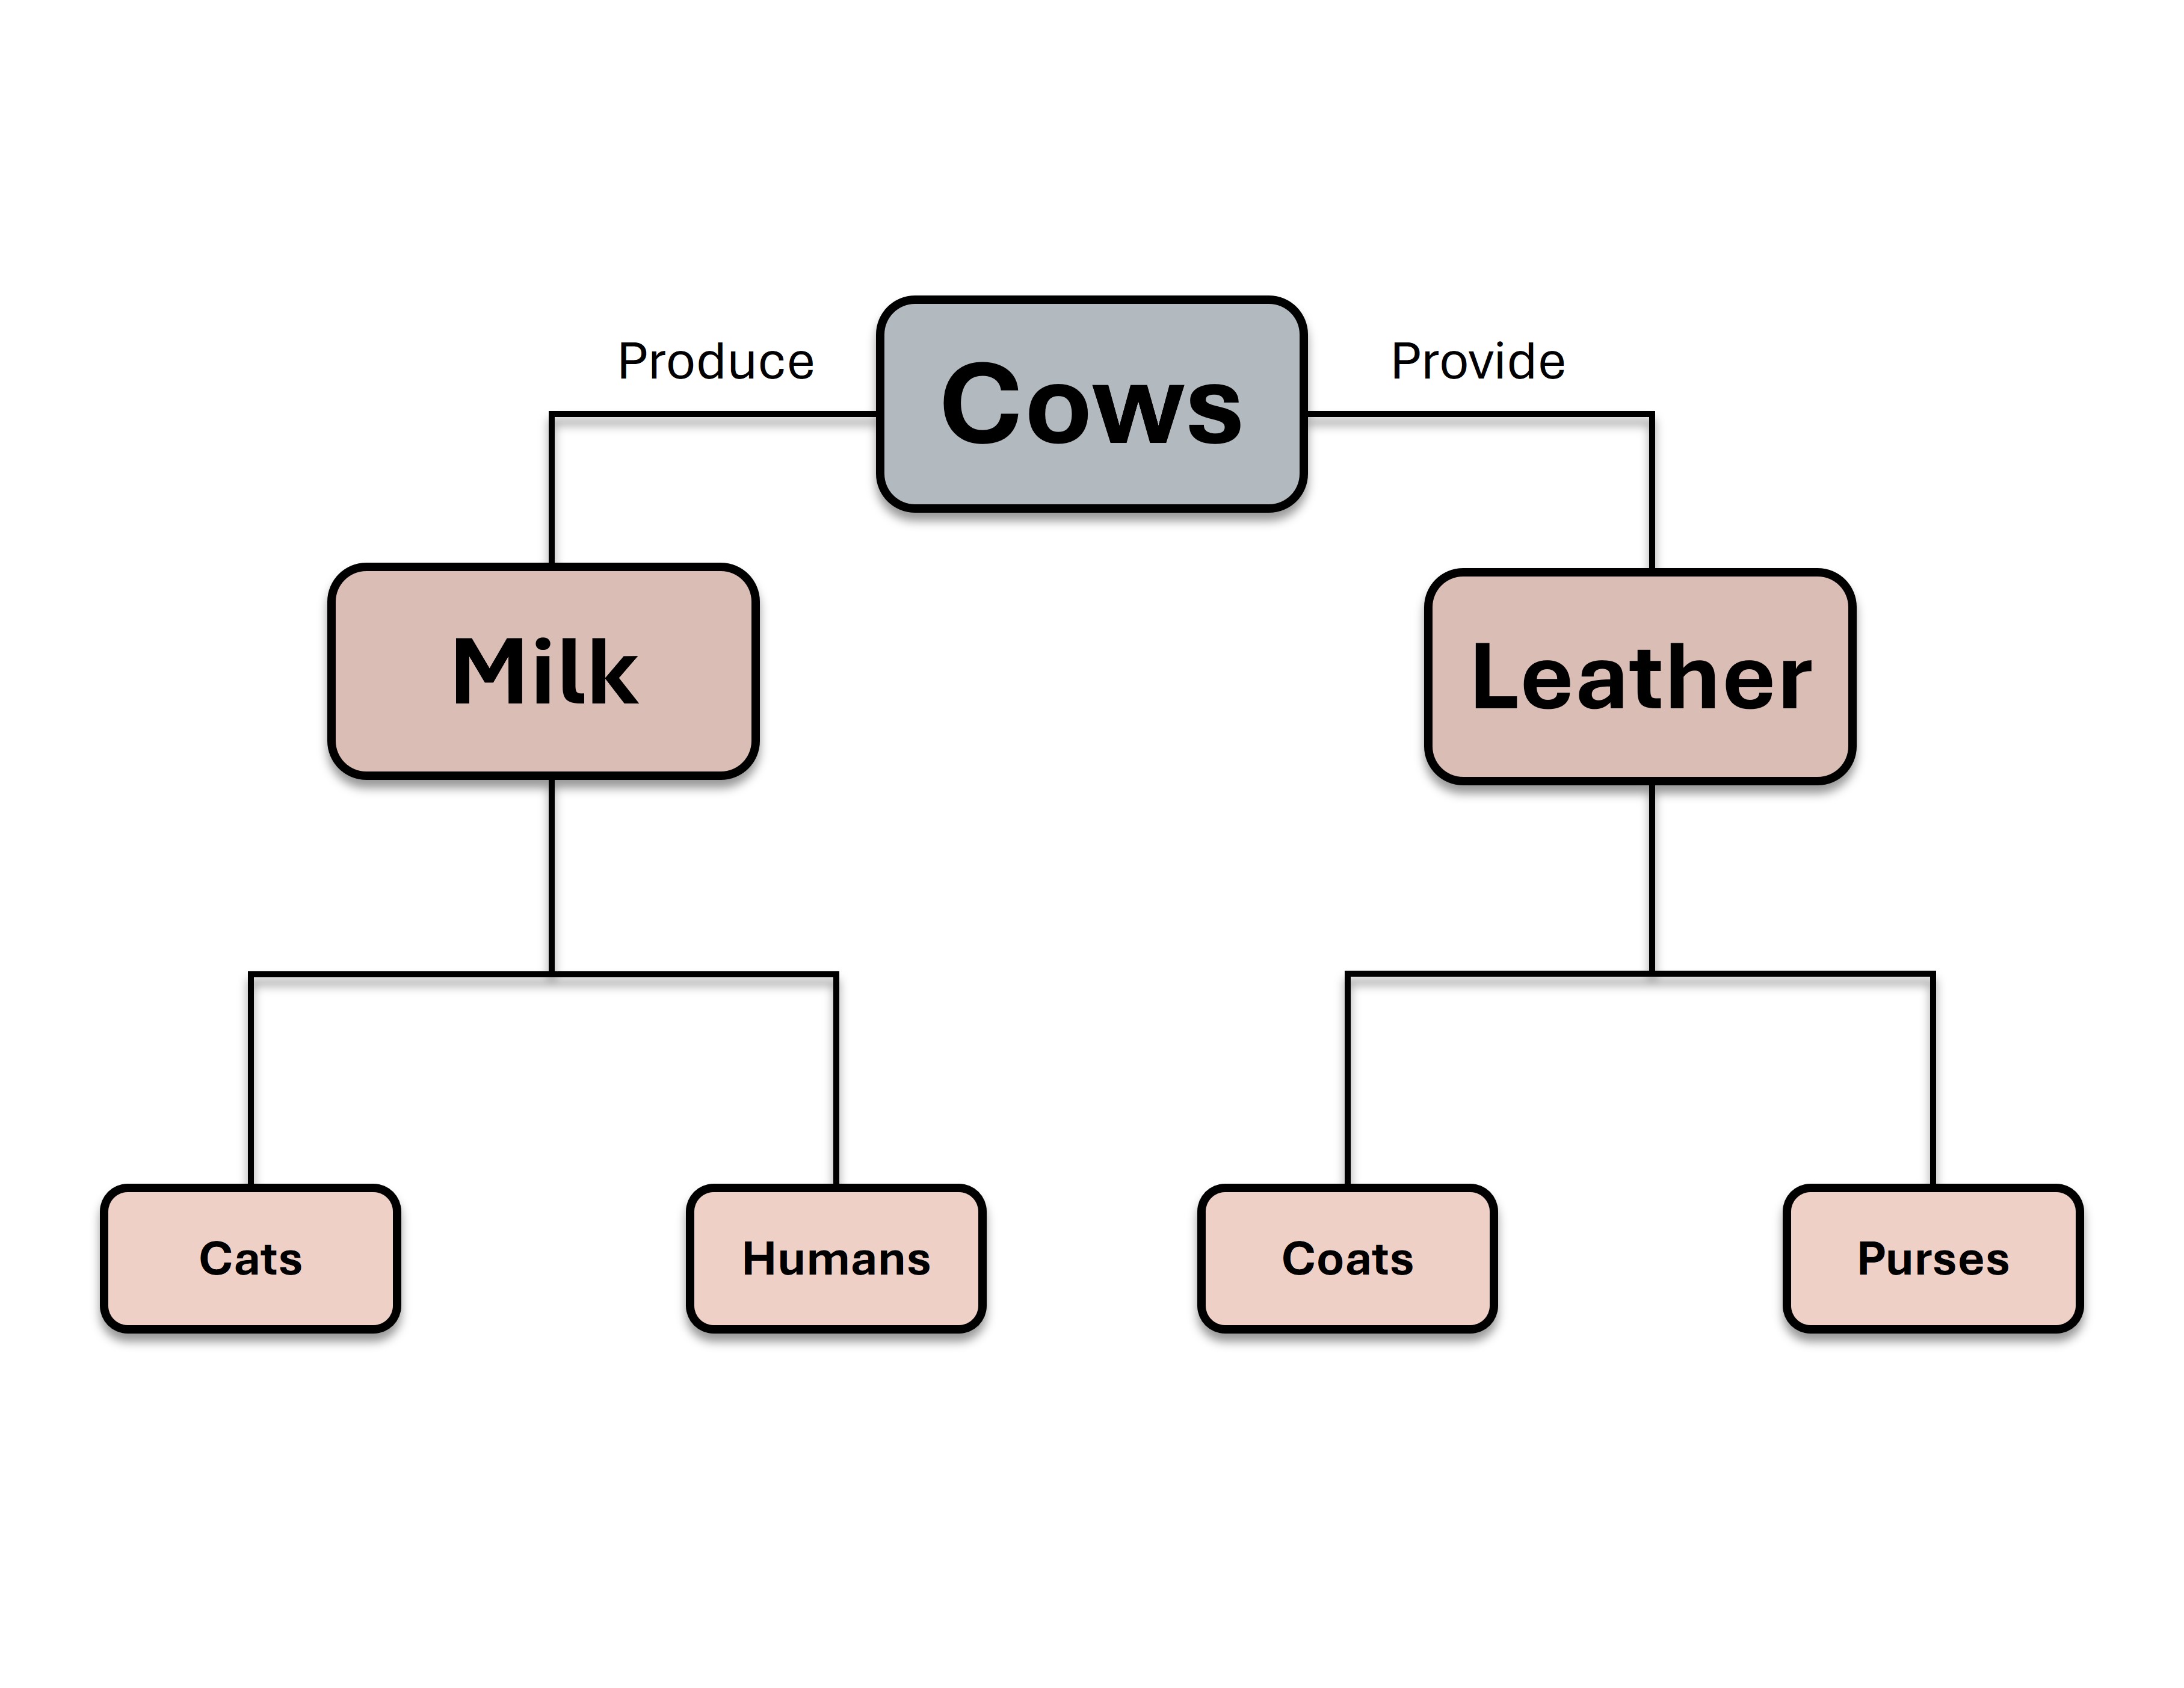
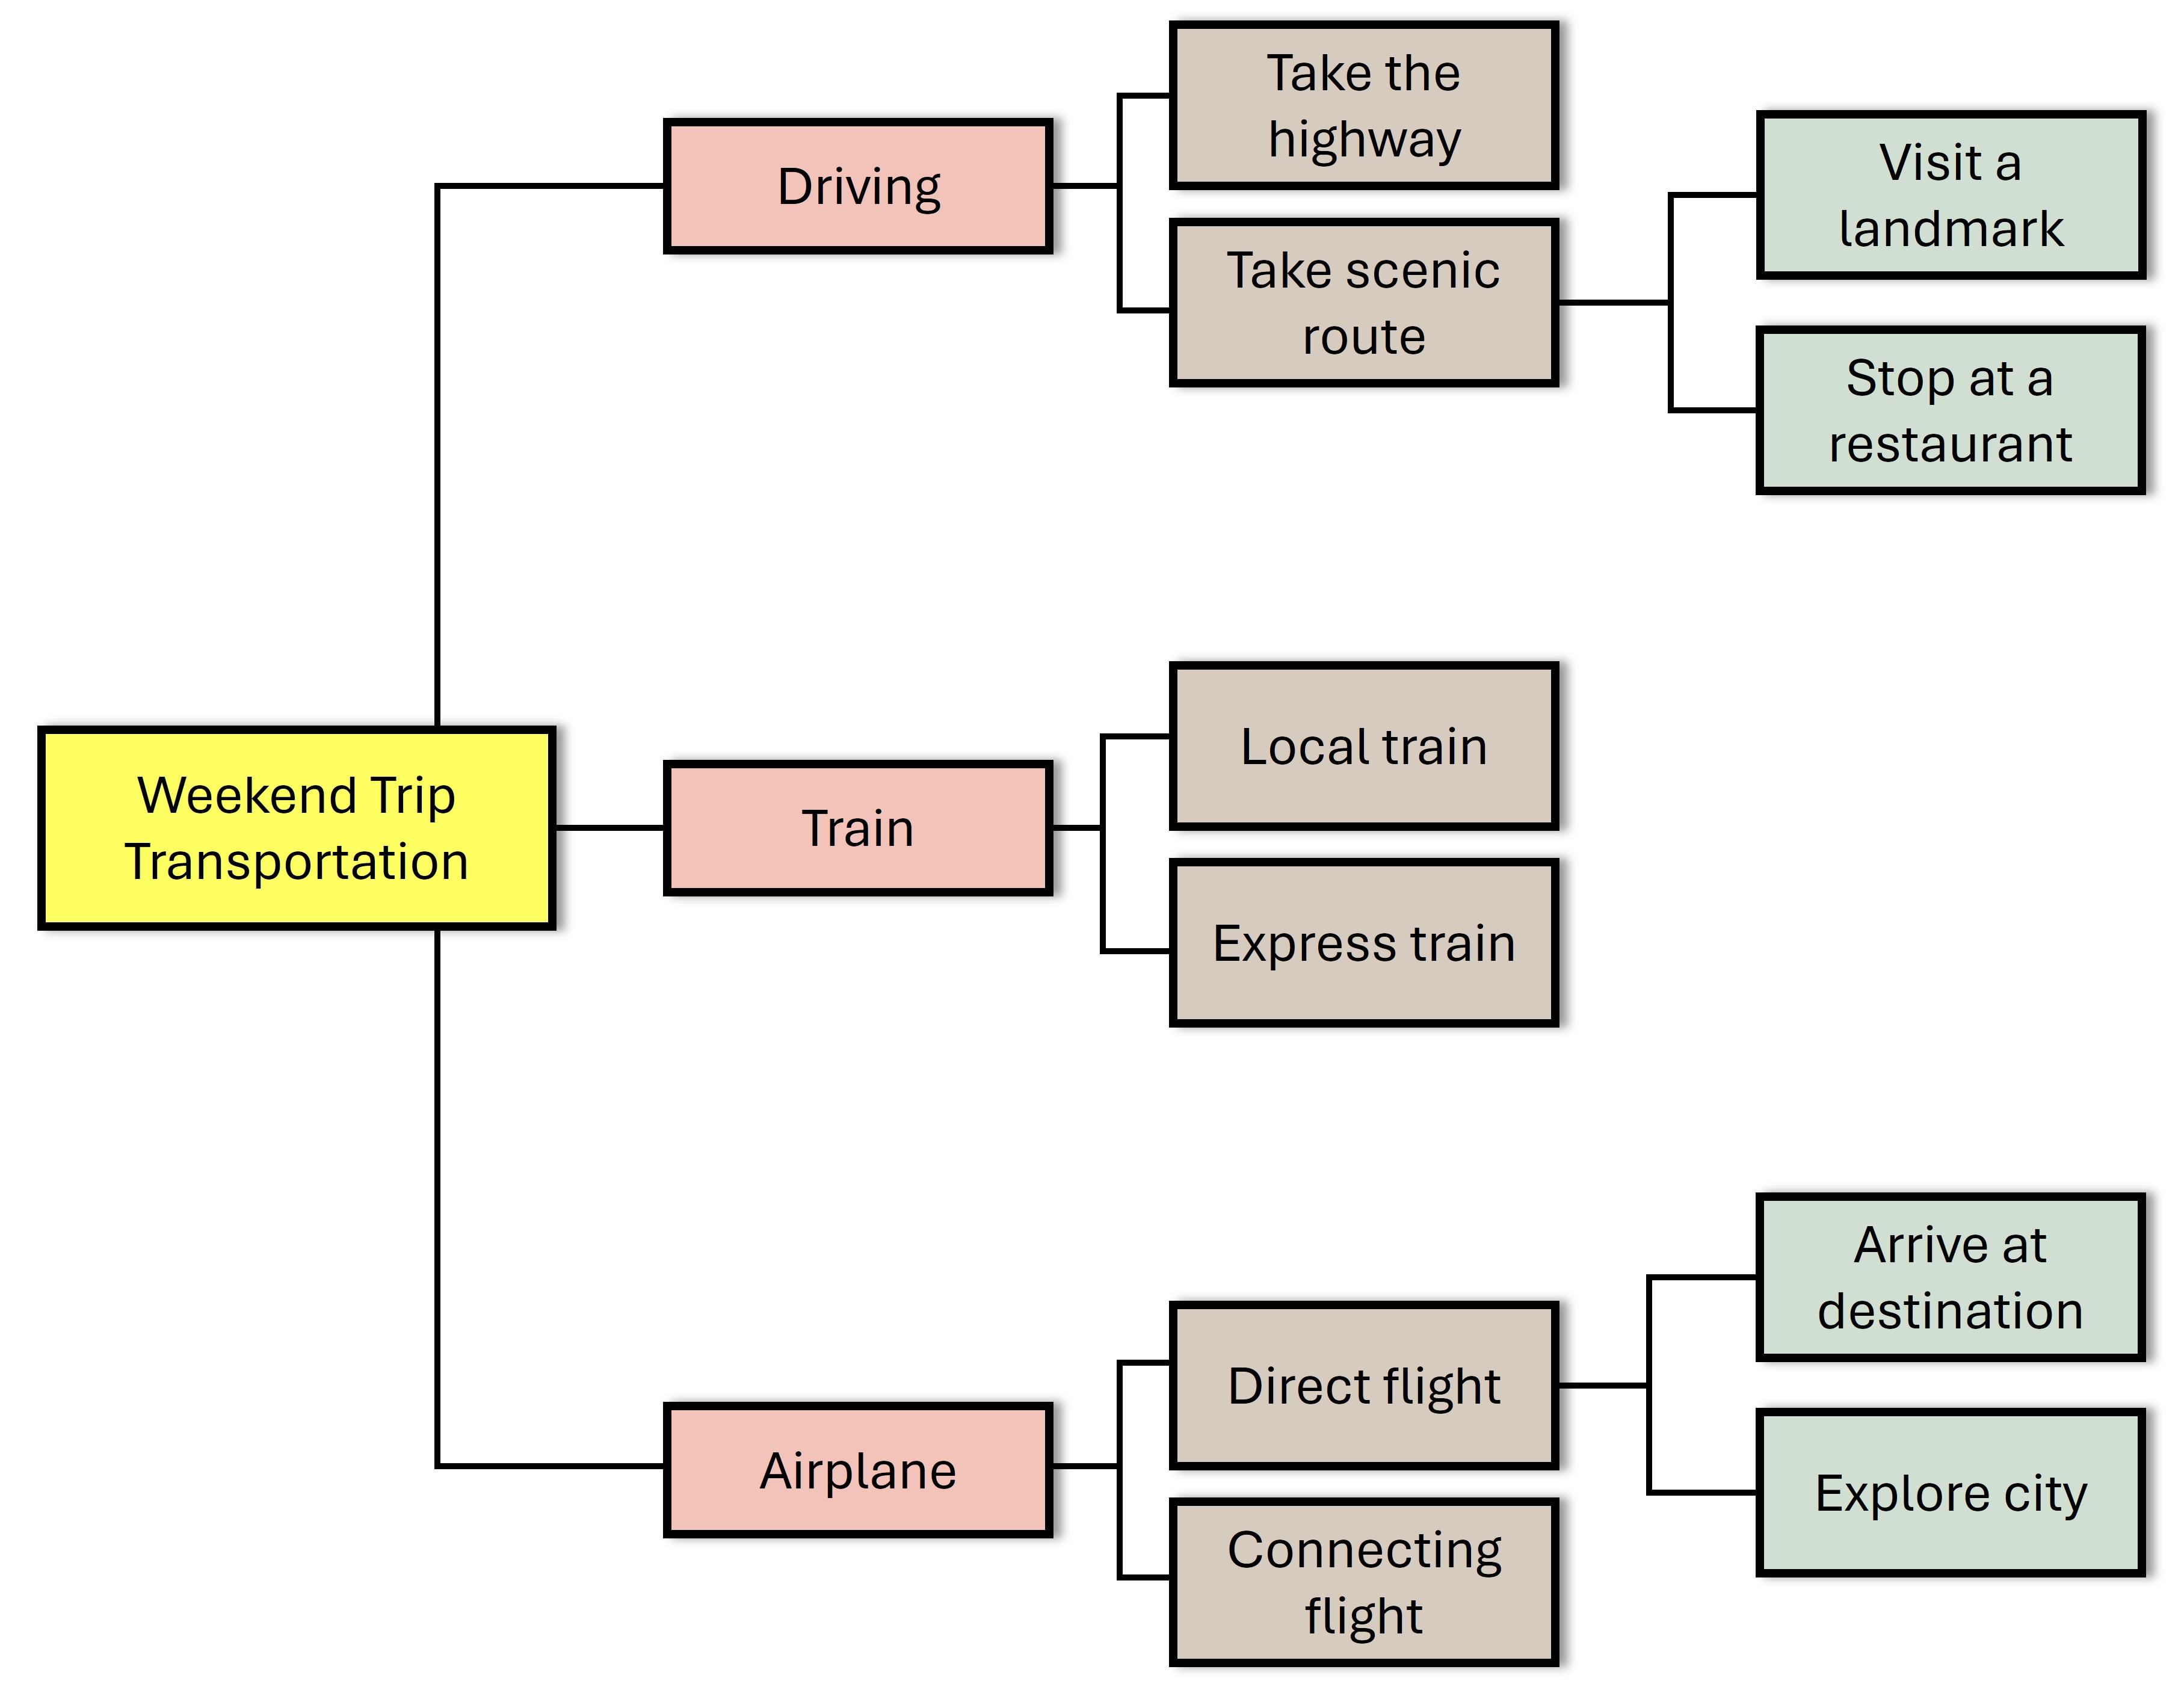
➧ Shows hierarchy or branching structure.
➧ Useful in classification or decision-making.
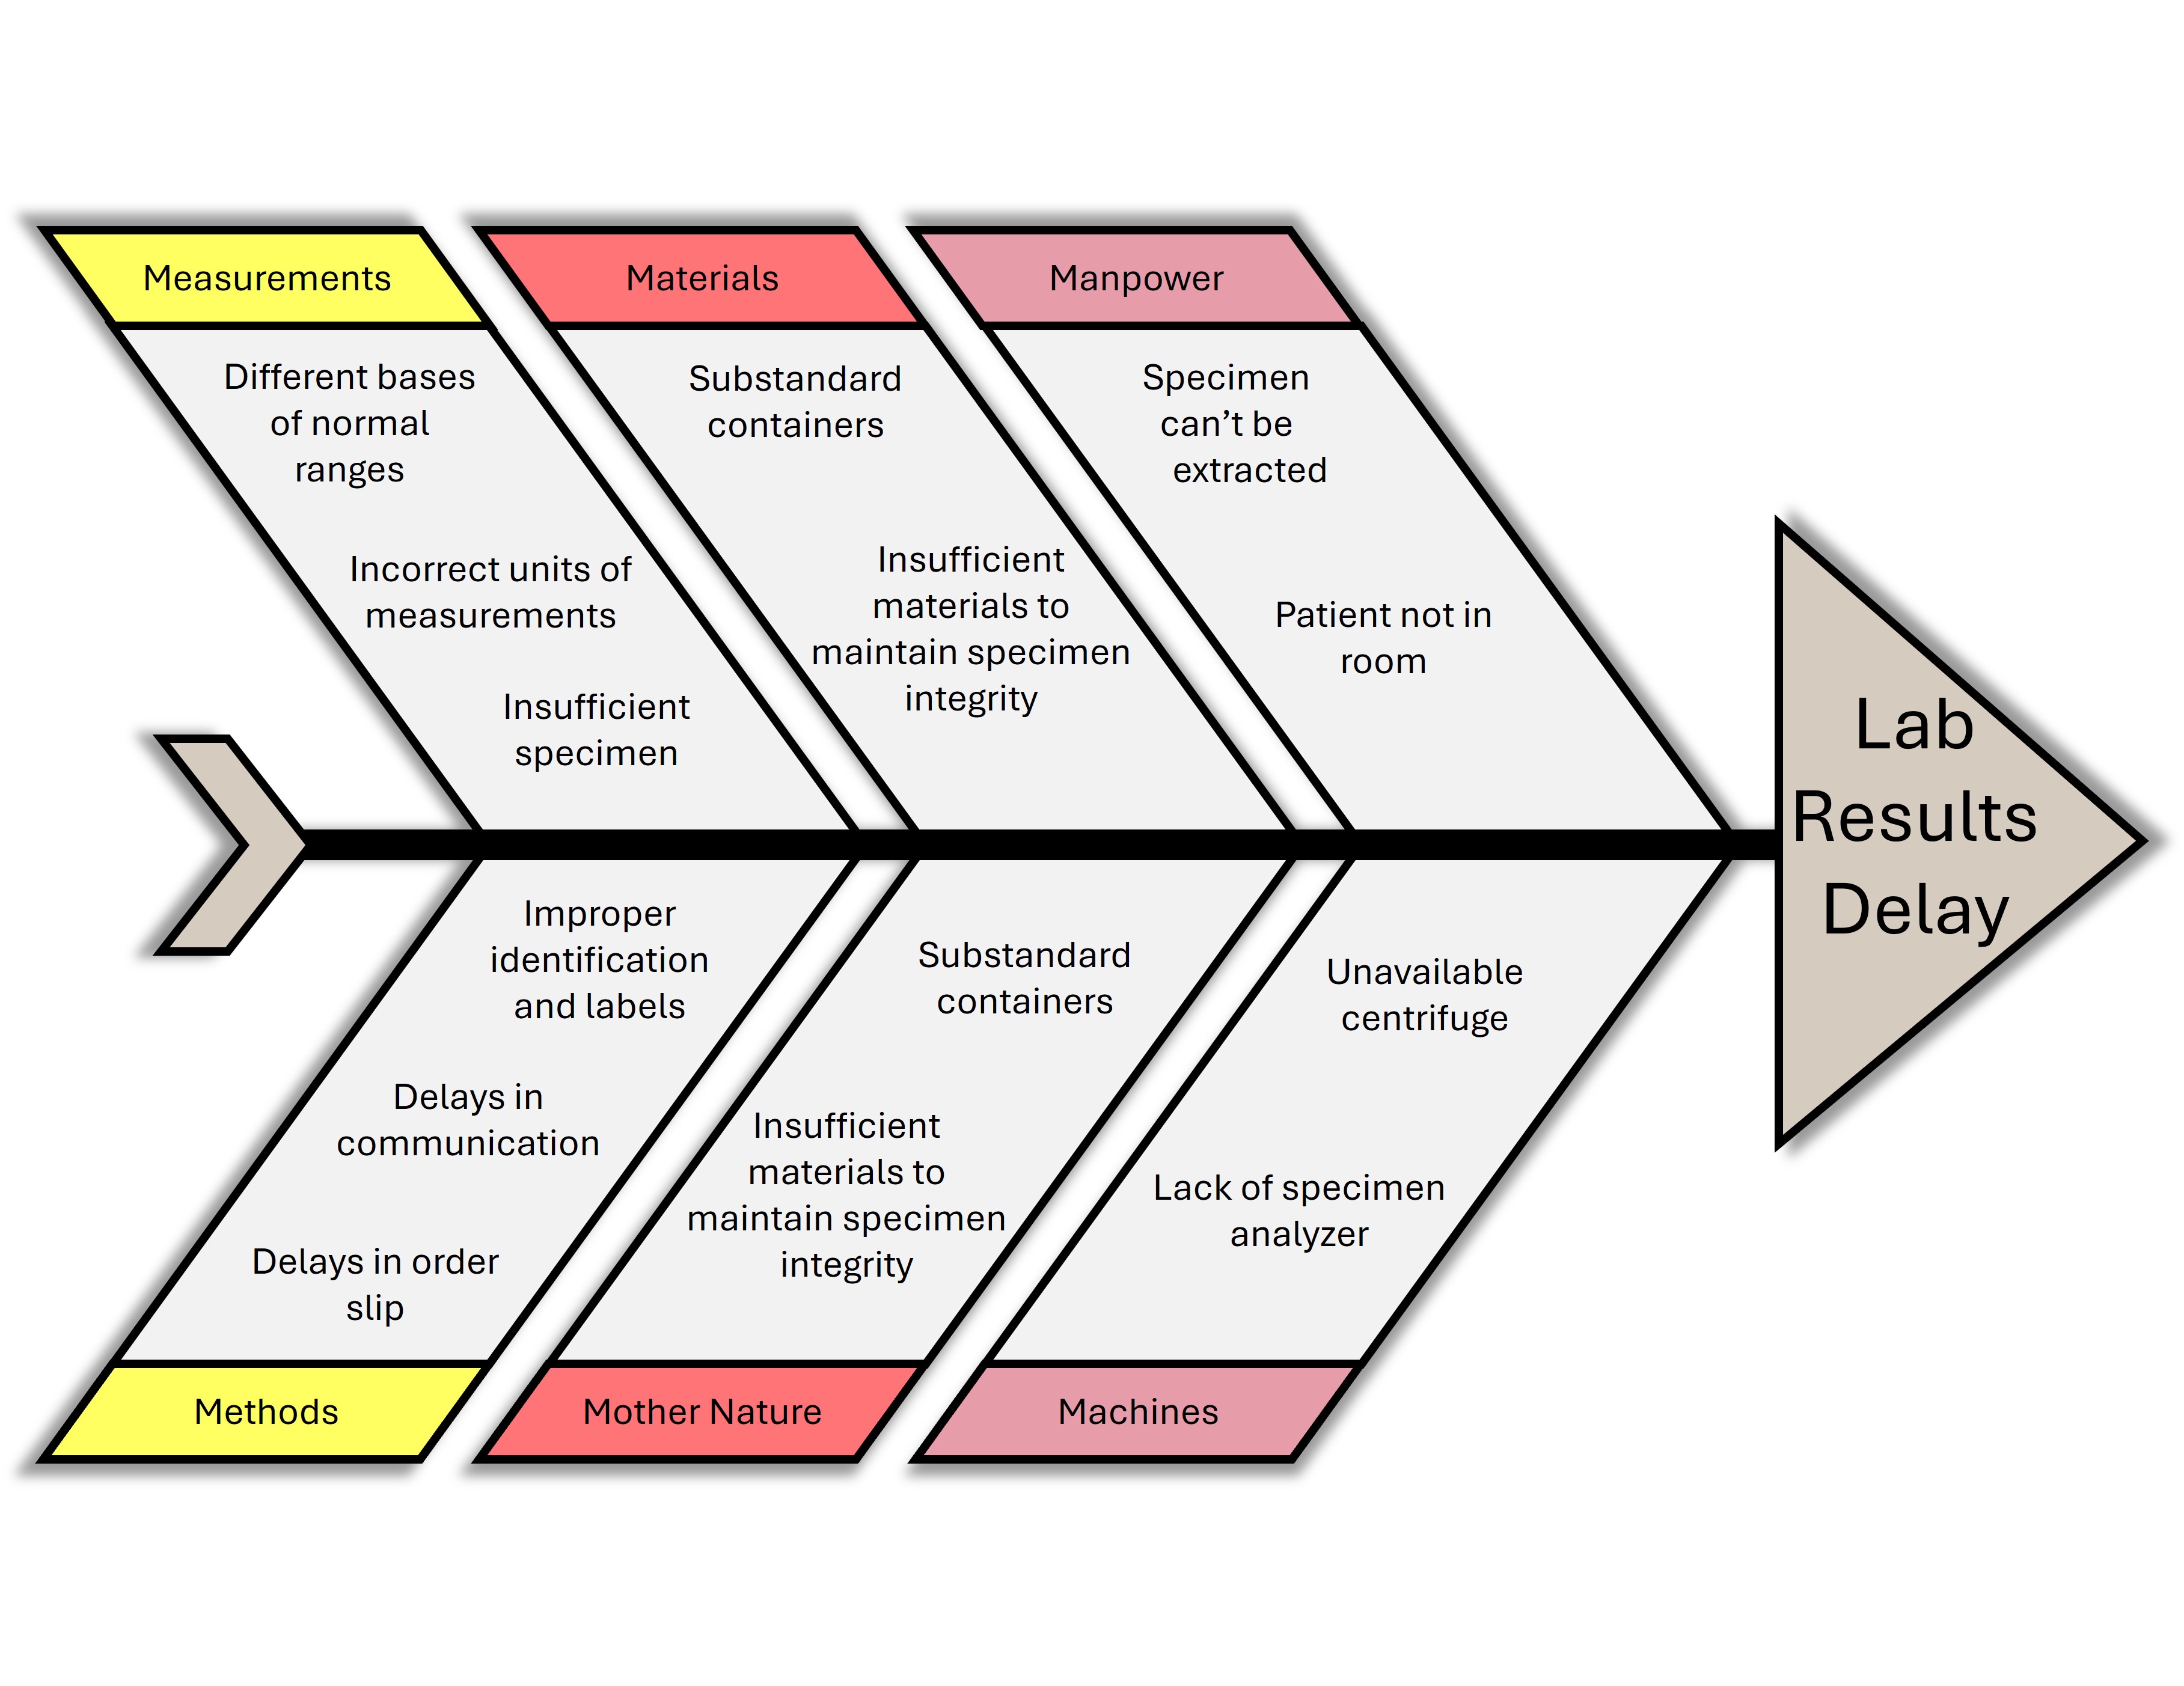
➧ Identifies root causes of a problem.
➧ Common in quality control and analysis.
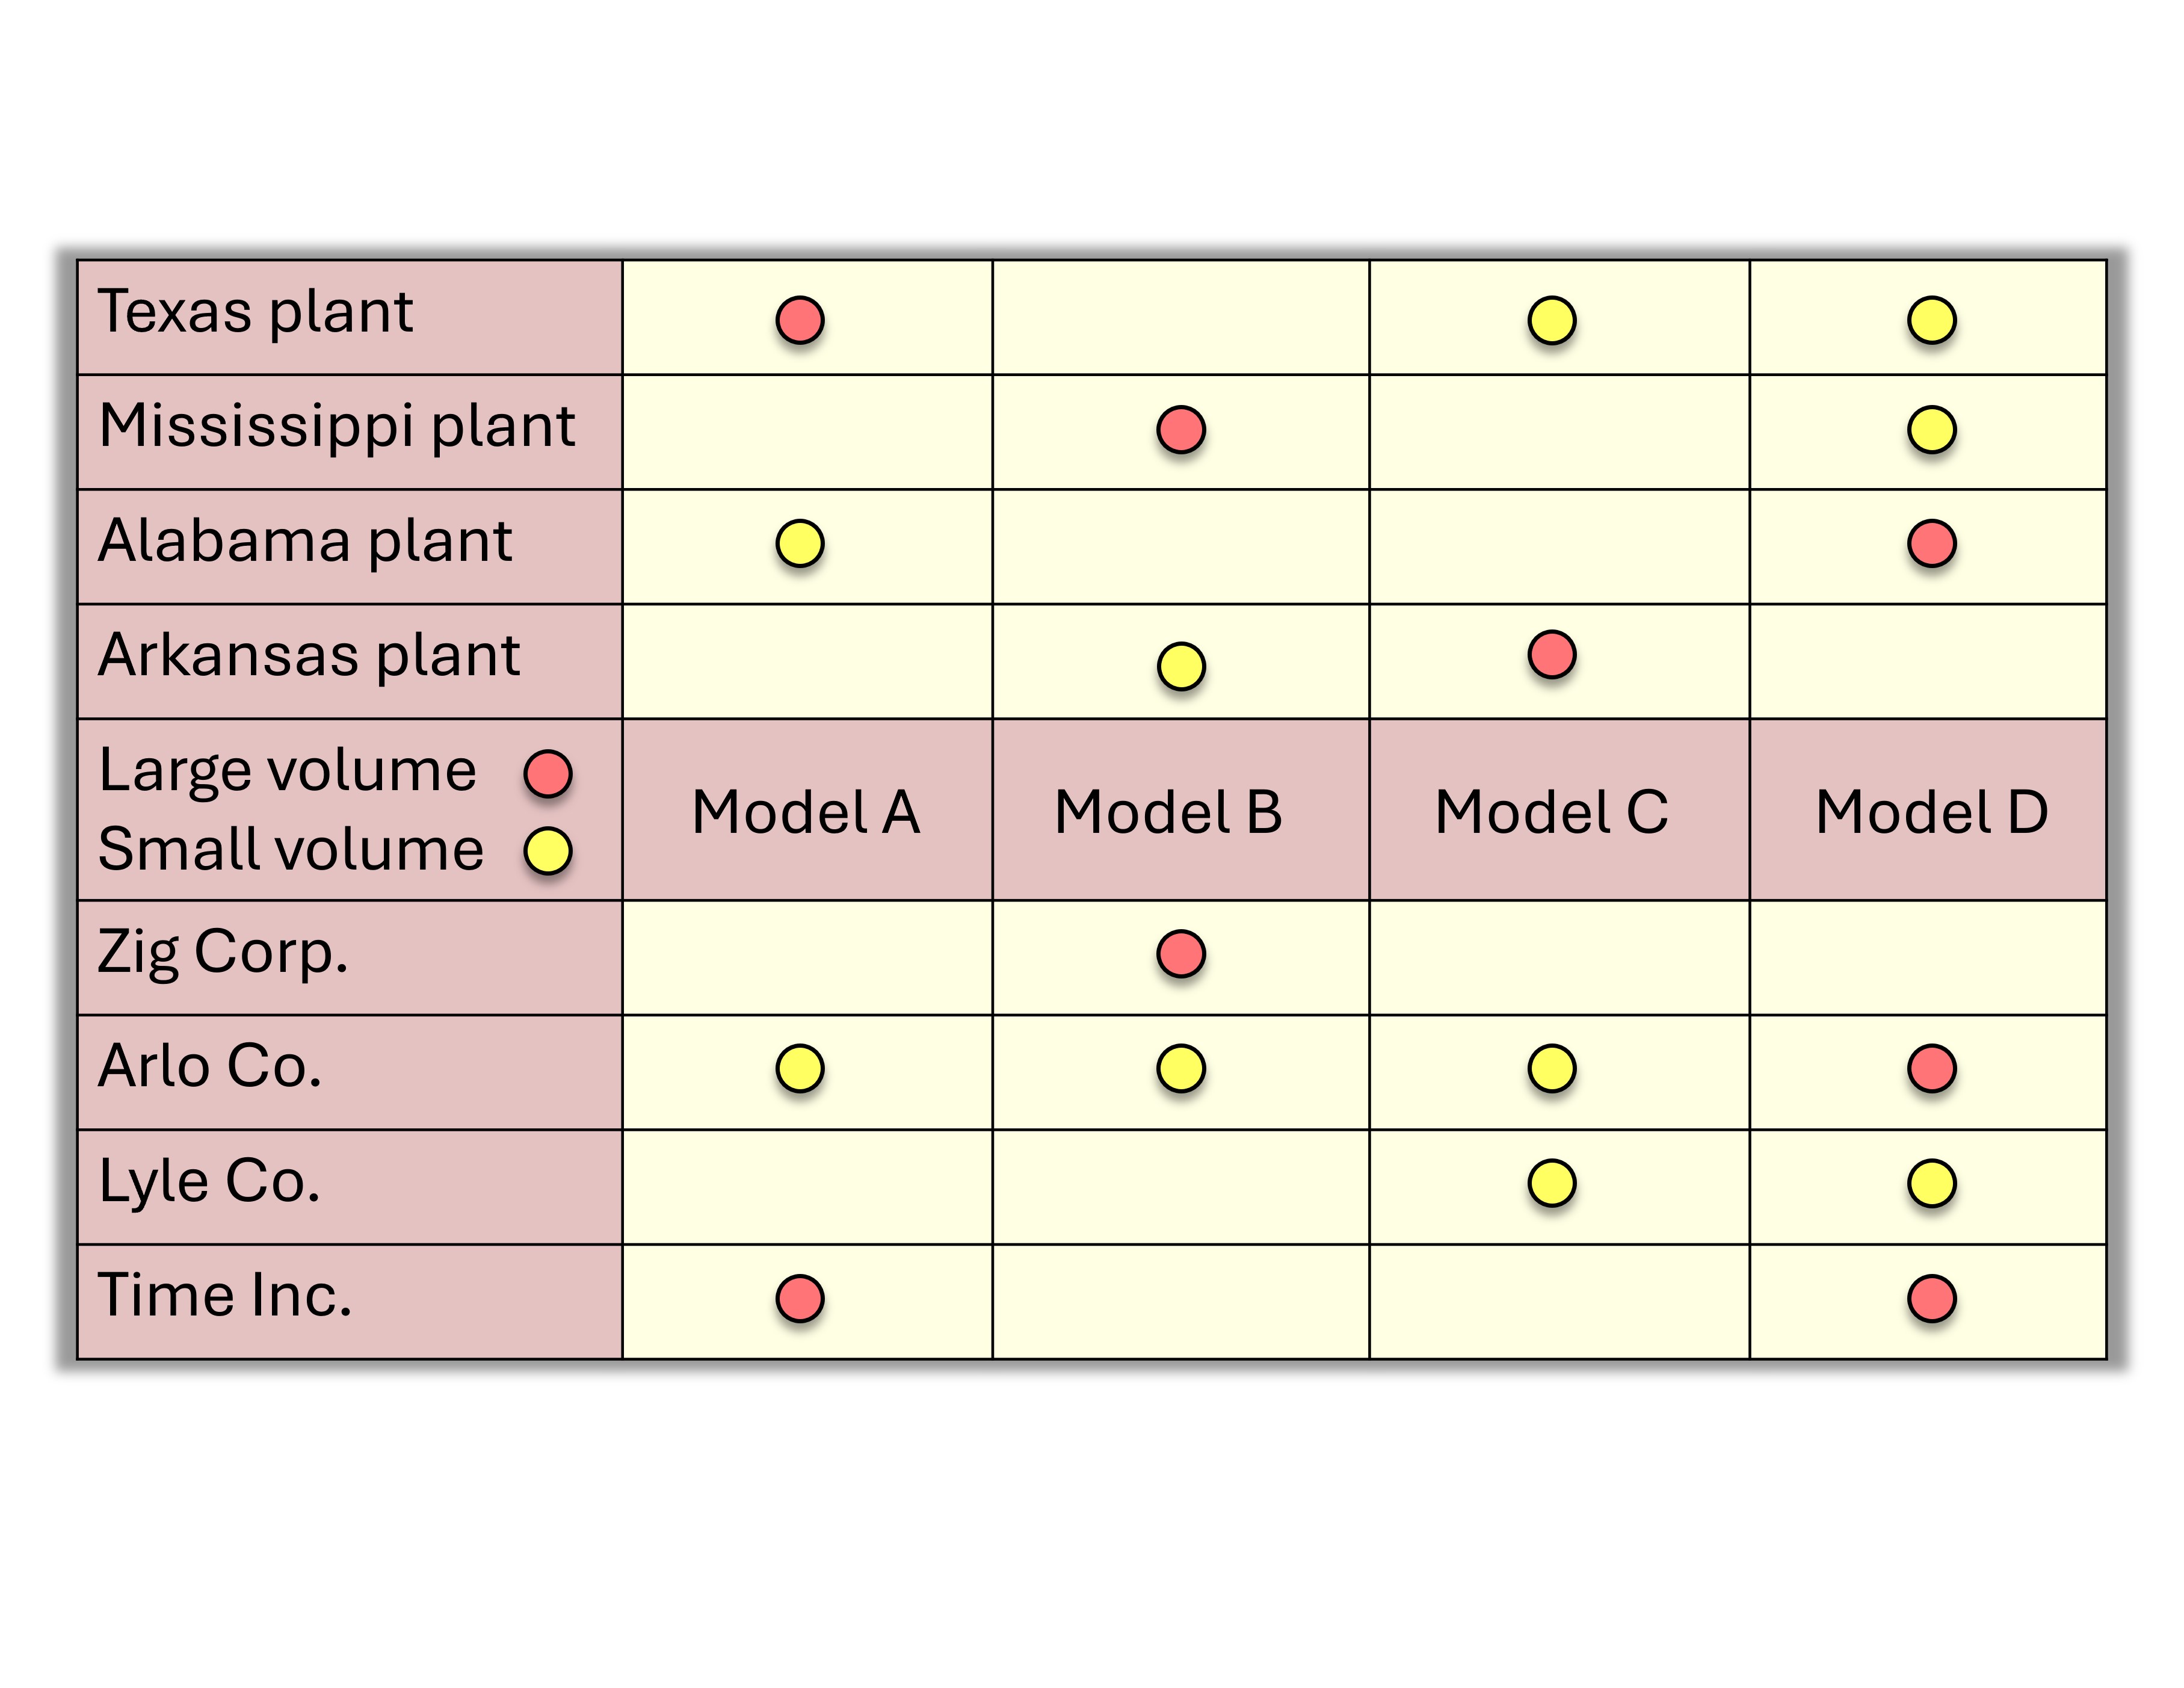
➧ Shows relationships between two or more variables in a grid format.
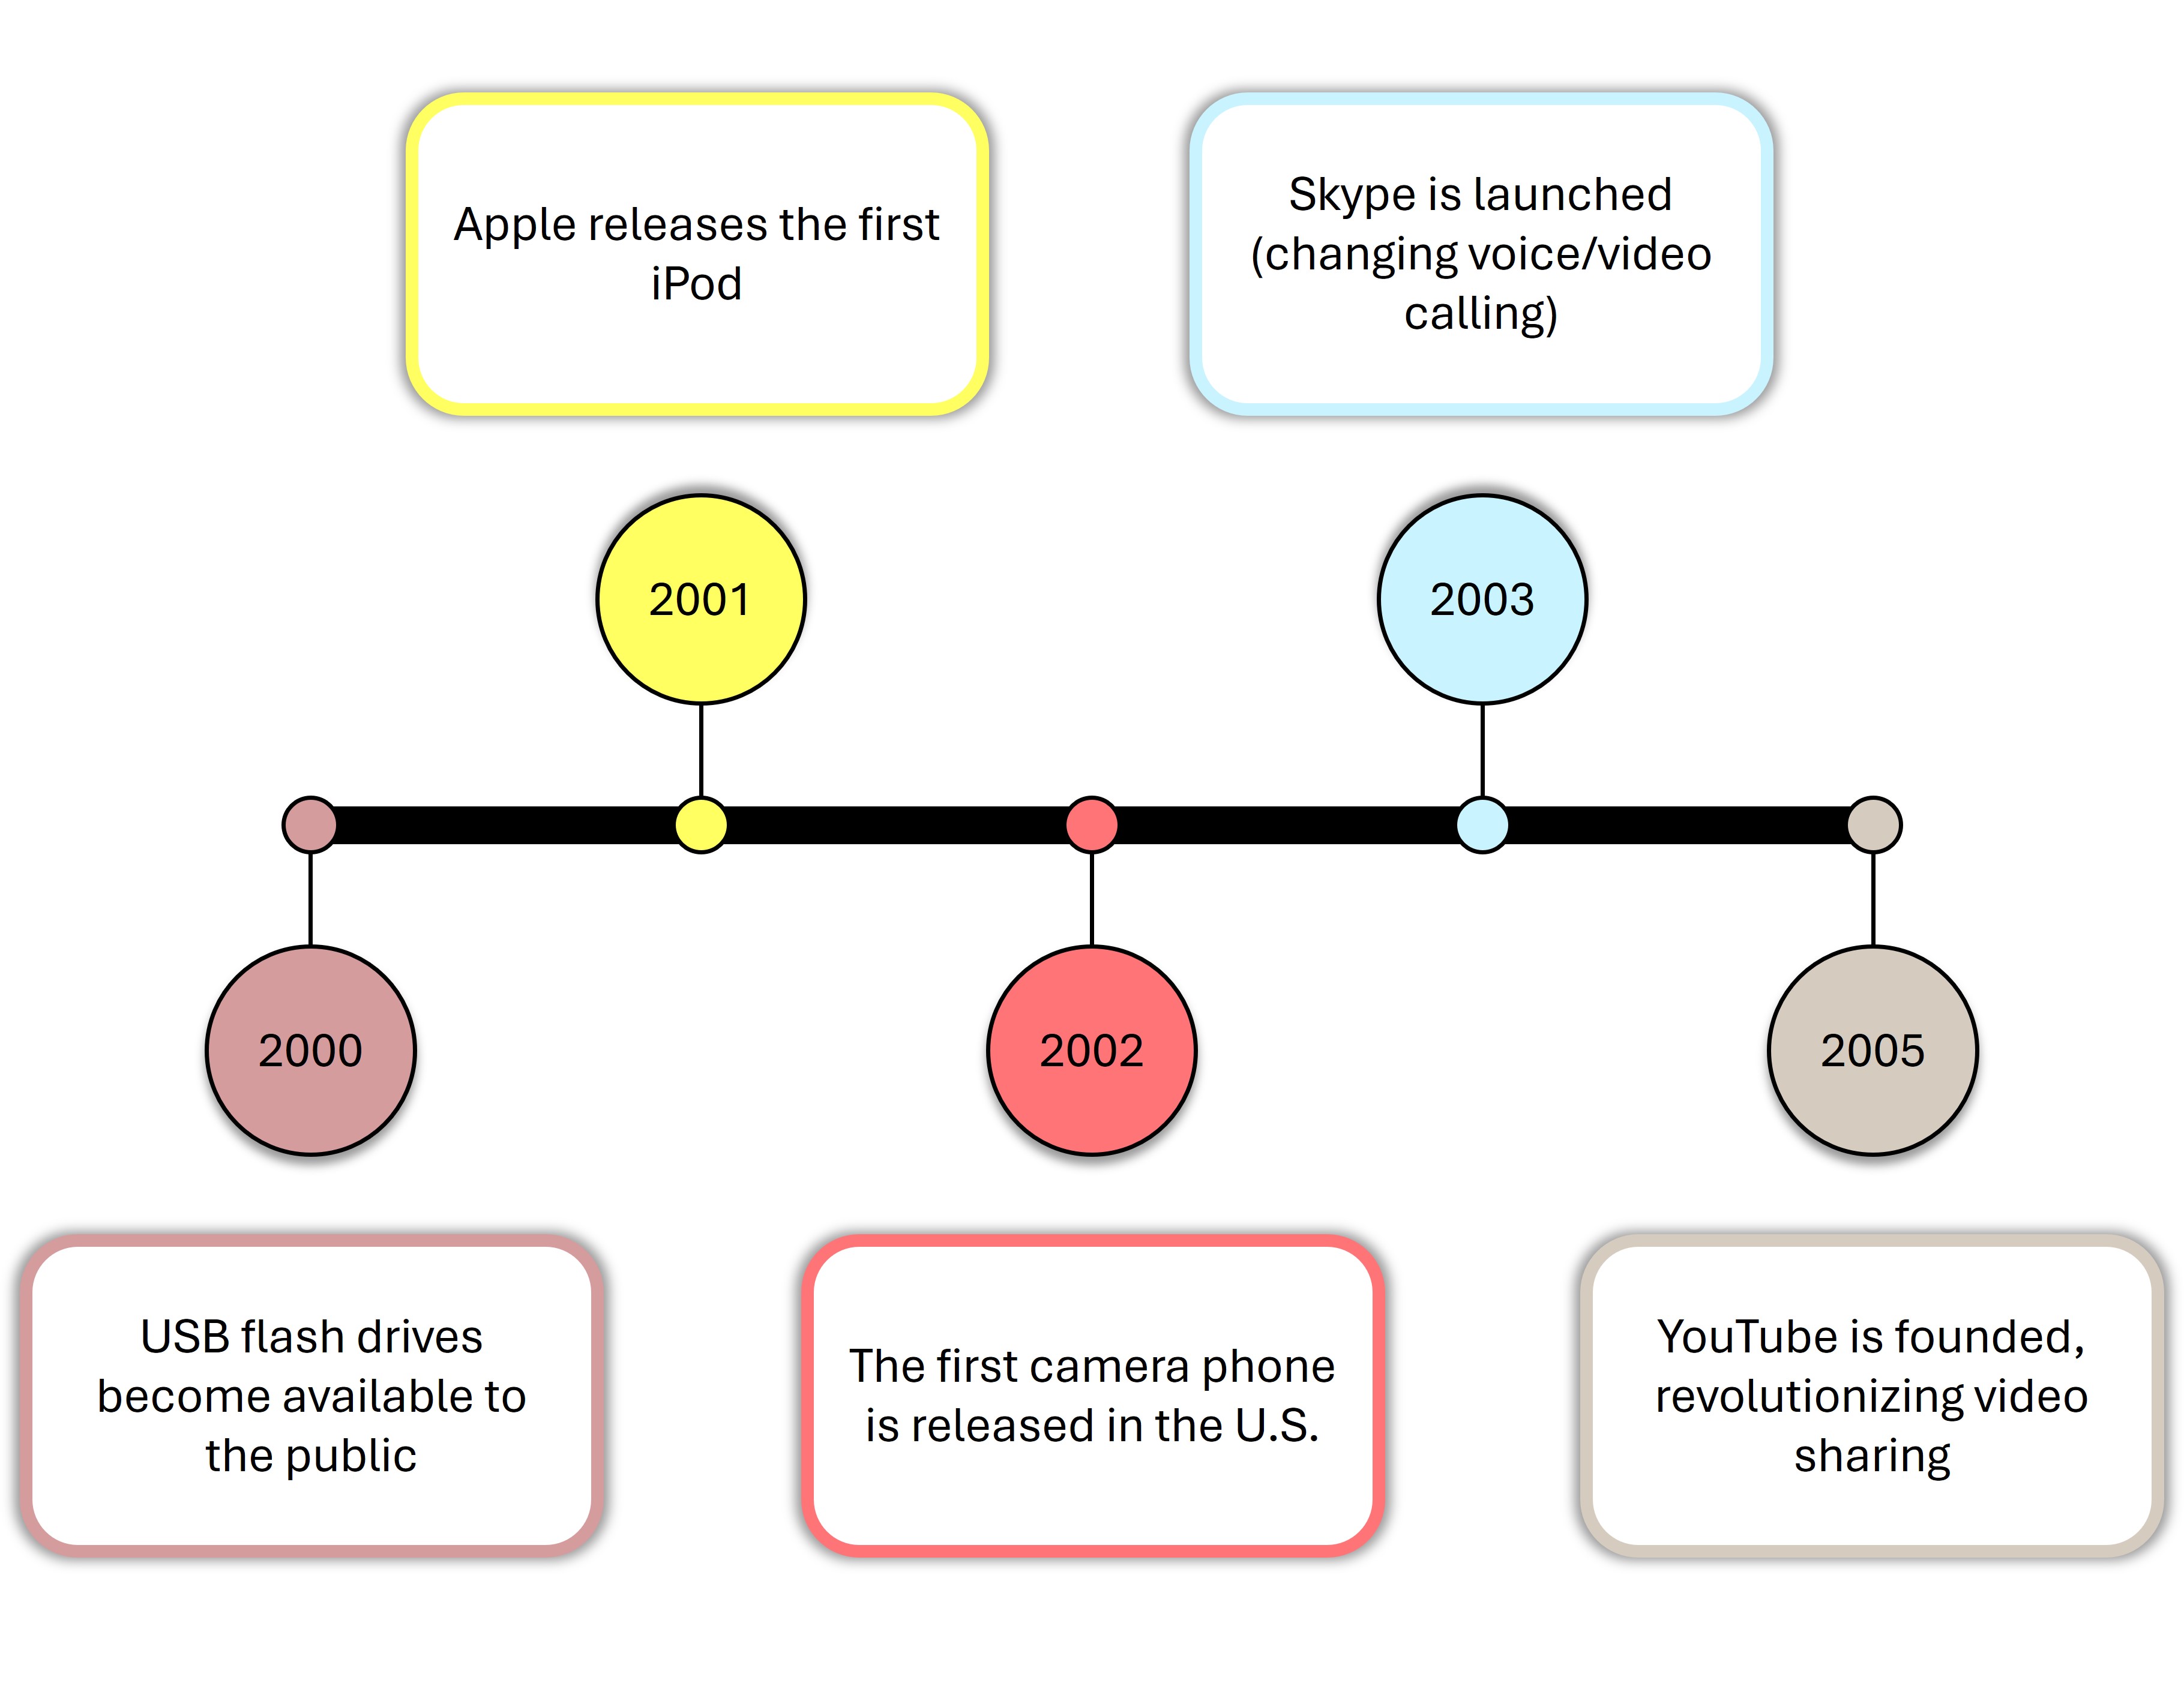
➧ Visual sequence of events in chronological order.
➧ Common in history and research planning.
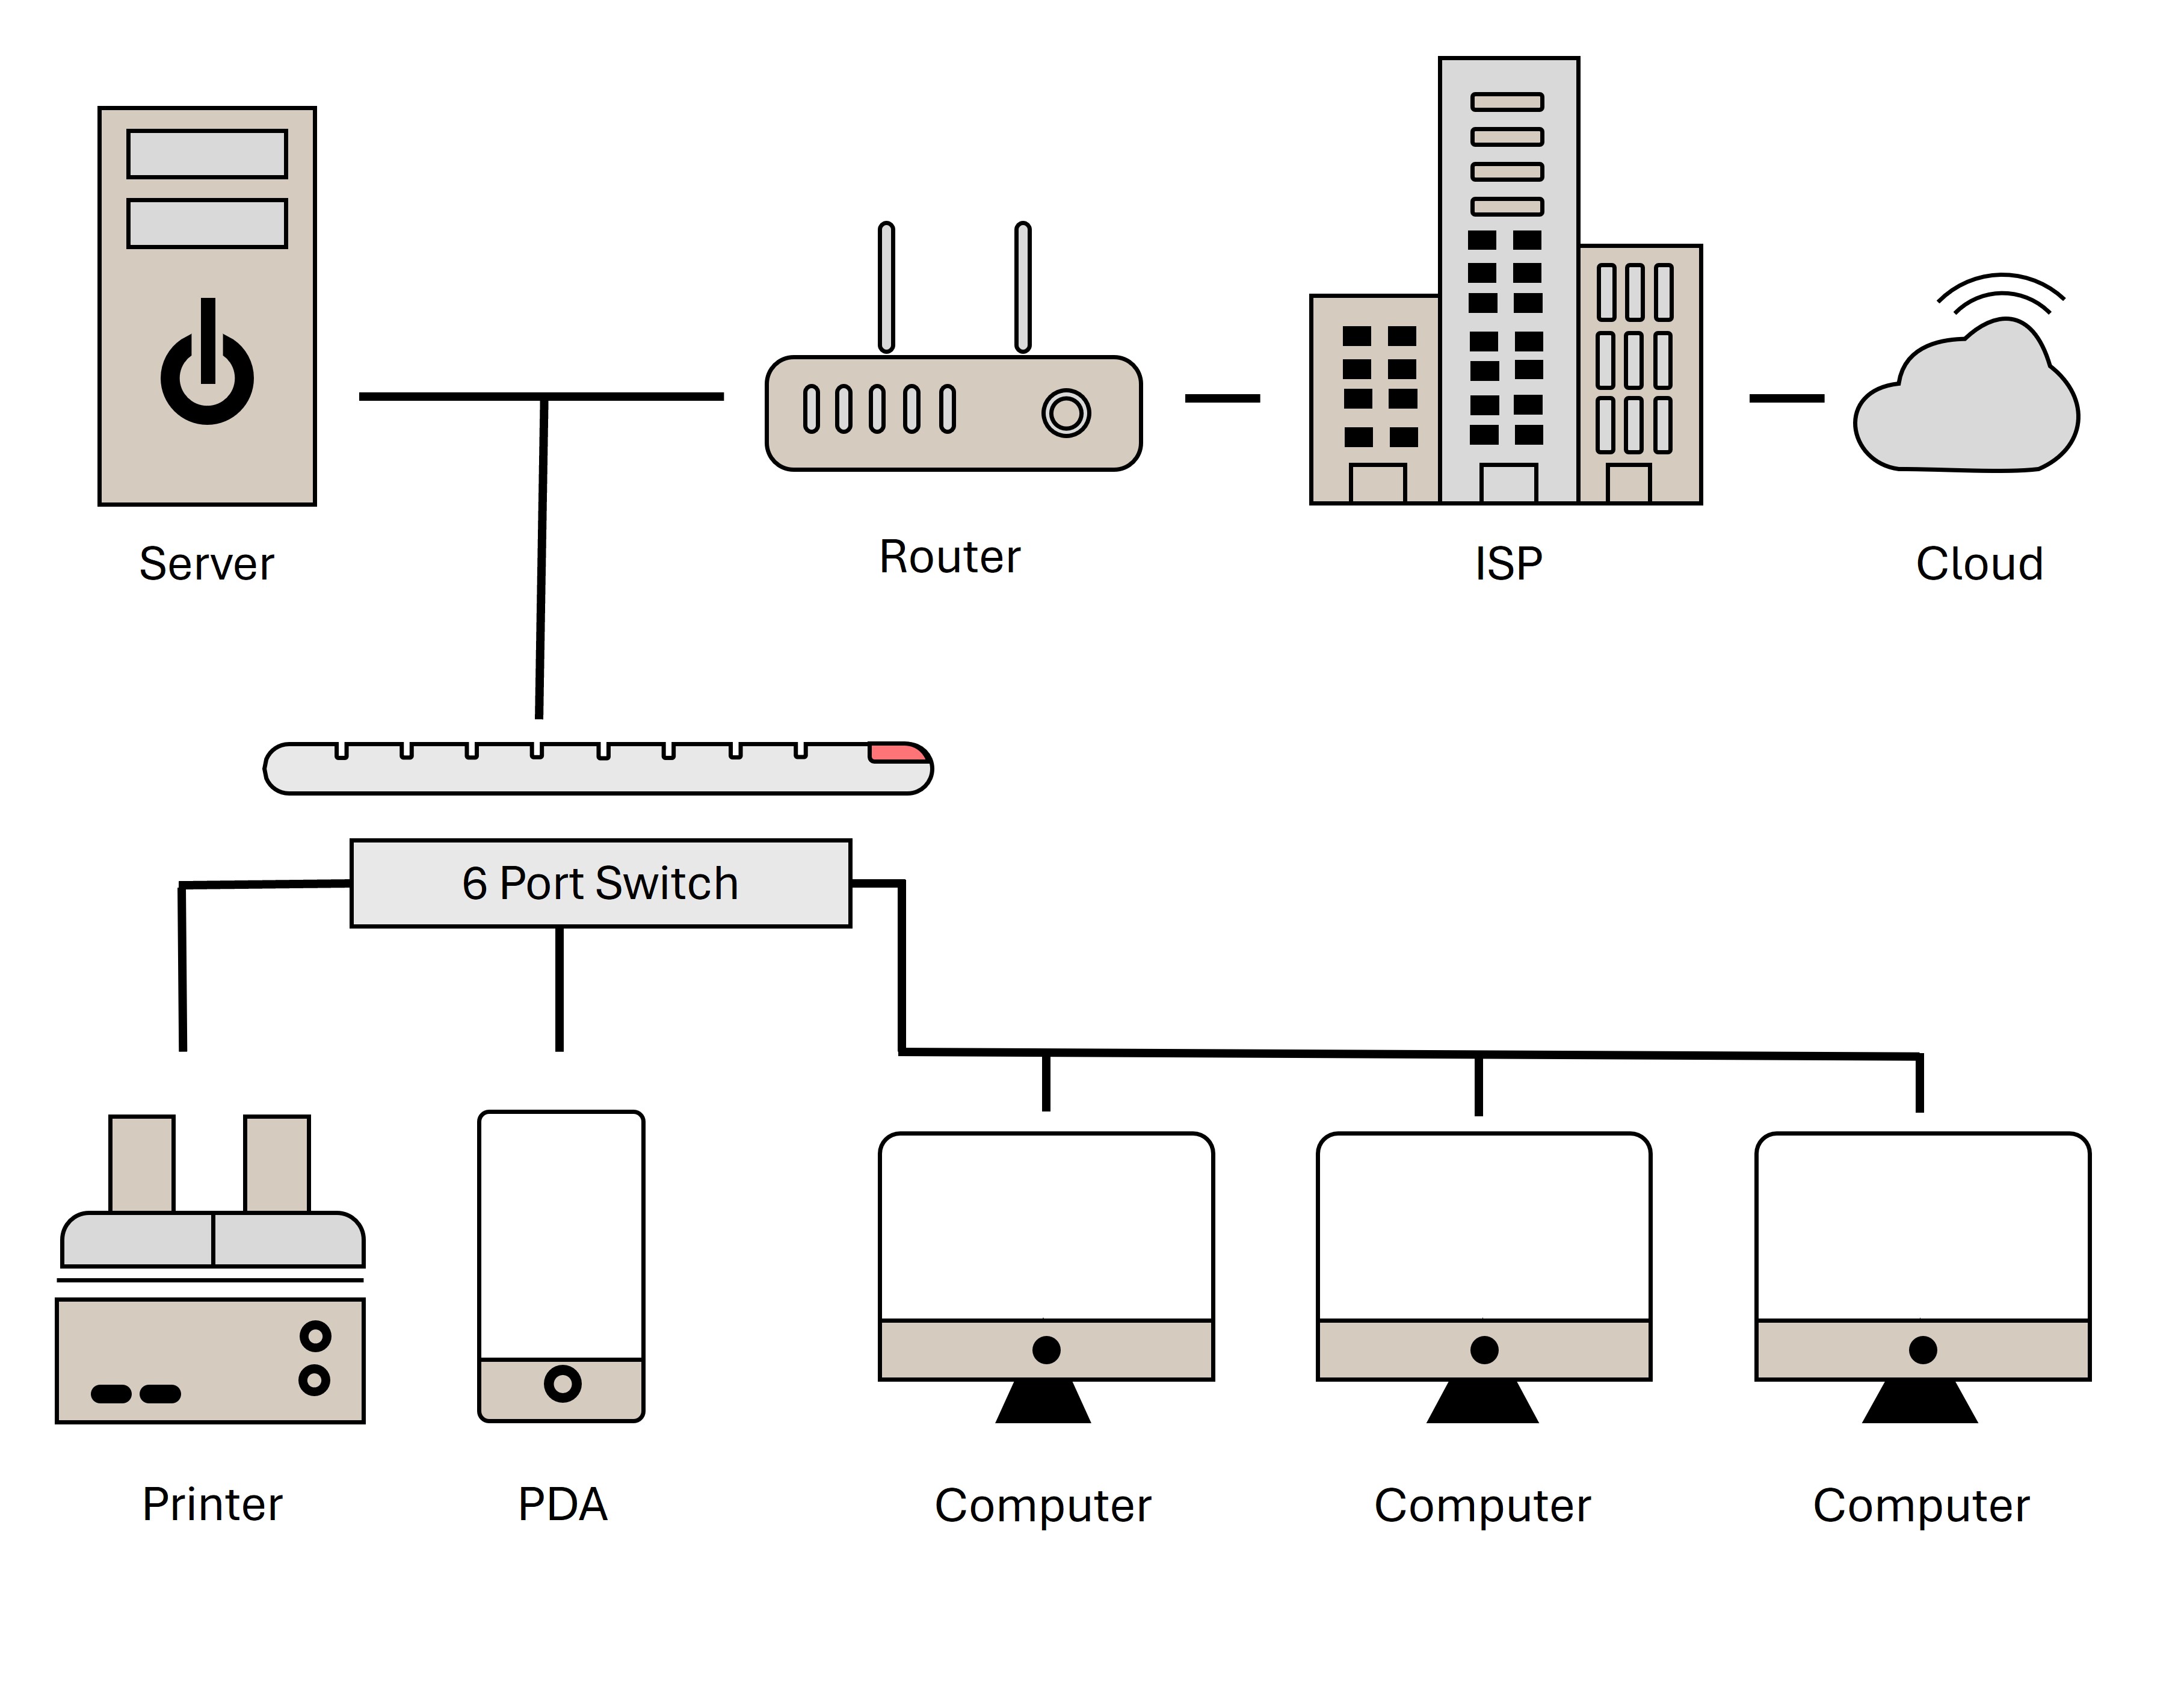
➧ Displays interconnected elements (nodes and links).
➧ Common in IT, social sciences, and biology.
More Lessons ➧ Here
About Blossomings
Blossomings is an educational platform dedicated to providing high-quality
learning materials, worksheets, and structured lessons for learners worldwide.
Our goal is to make learning simple, engaging, and accessible for everyone.